
Saved reports
A saved report is a view of the monitoring data that somebody kept: a form, a period, a set of questions and any filters, stored under a name.
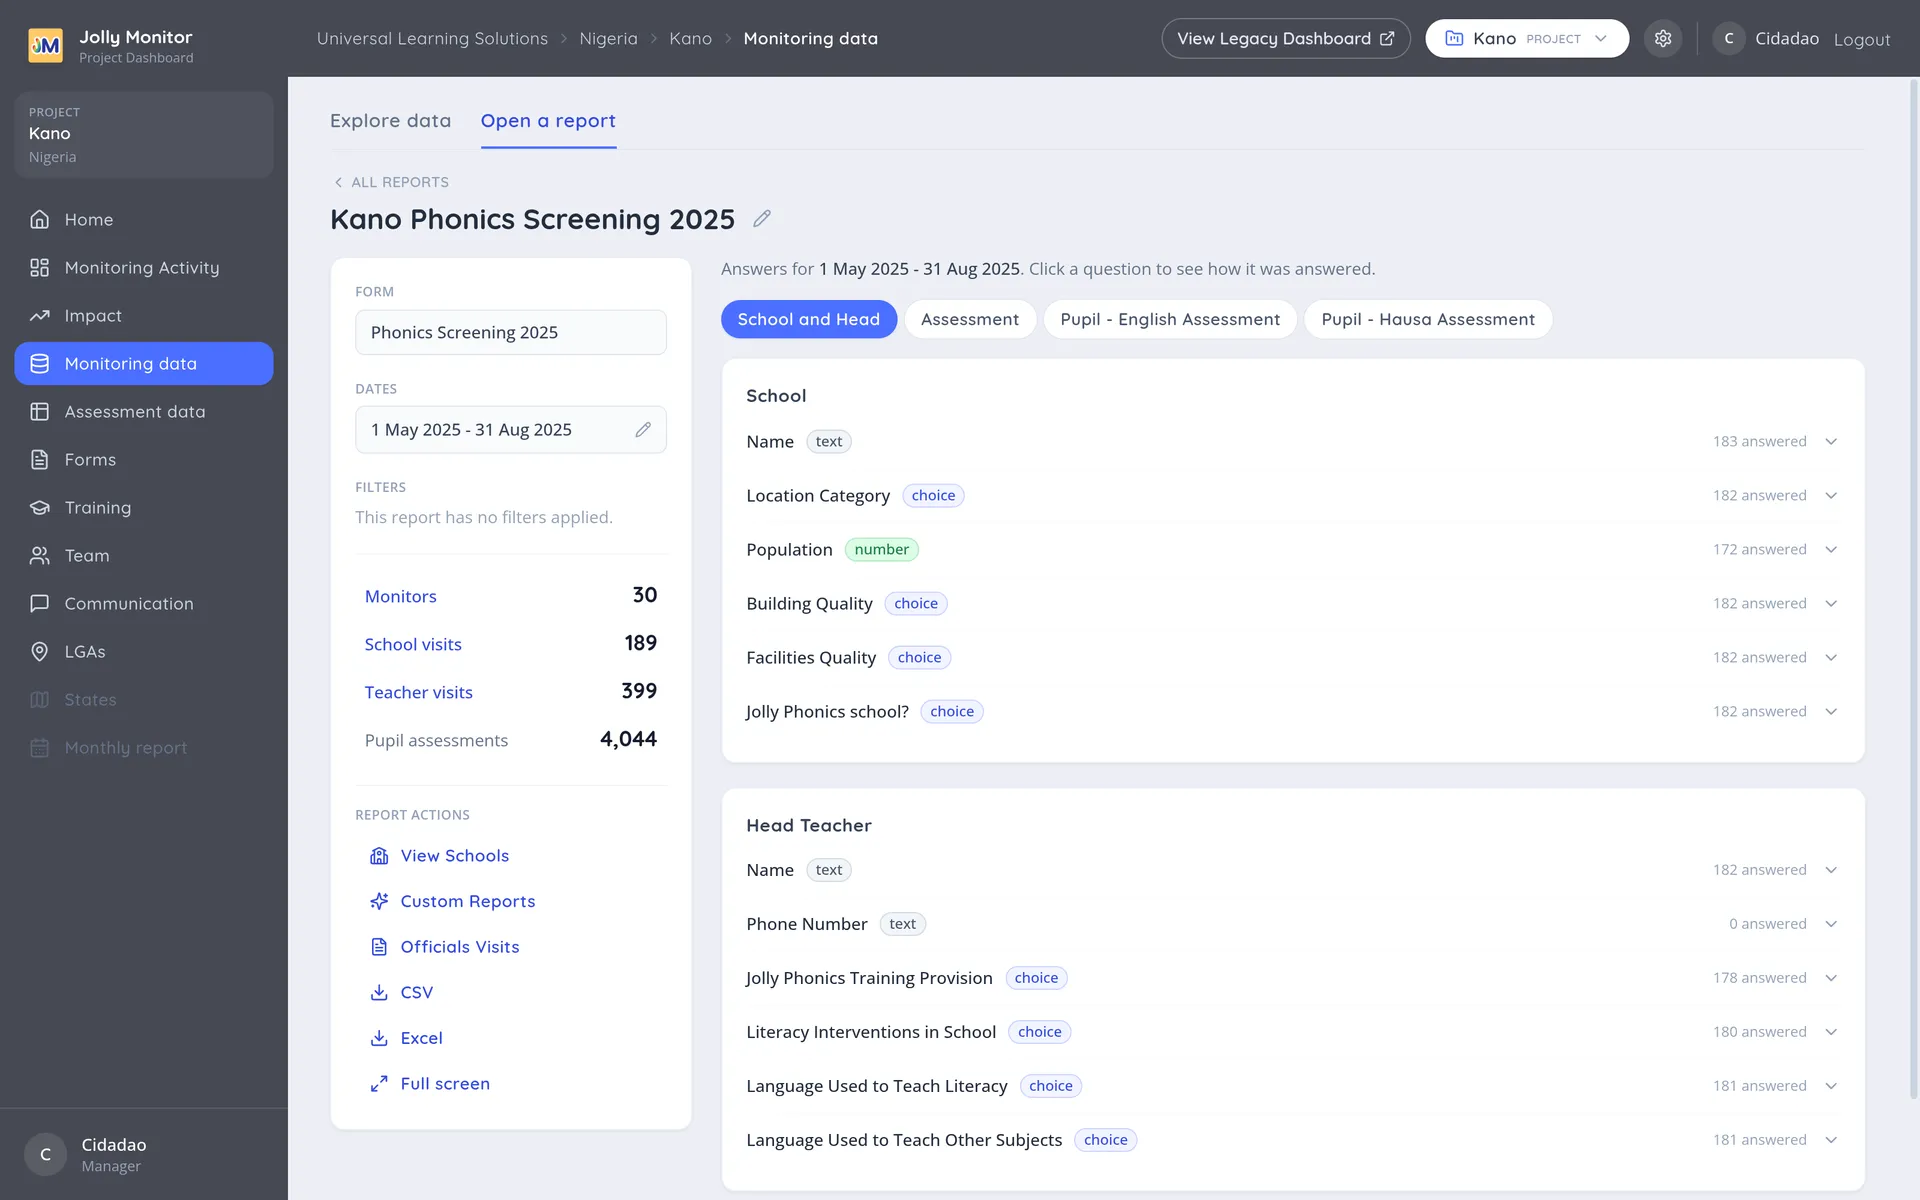
Opening a report
Section titled “Opening a report”The Open a report tab of a project’s Monitoring data section lists the project’s reports grouped by form. Choosing one loads it, and the open report’s All reports button brings the list back.
The report then shows what it is made of:
| Part | What it fixes |
|---|---|
| Form | Which monitoring form the answers come from |
| Dates | The period covered |
| Filters | Any narrowing applied, or “This report has no filters applied.” |
Below that come the same counters and questions as the explorer.
What you can do
Section titled “What you can do”Once open, a report behaves like any explored view: click a question to see how it was answered. The report also carries its own action bar:
- View Schools and Officials Visits list the schools and the officials behind the report’s figures.
- Custom Reports opens the custom reports built on this report’s selection. See Custom reports.
- CSV and Excel download the report’s answers directly, in either format.
- Full screen reopens the report without the dashboard around it, which is the version for projecting in a meeting.
Why reports matter more than they look
Section titled “Why reports matter more than they look”Two people asking the same question of the same data can easily produce different numbers, simply by choosing a slightly different period or a different form. A saved report removes that: everyone opens the same definition.
Reports and periods
Section titled “Reports and periods”A report fixes its dates, which is what makes it a record of a period rather than a live view. A manager can edit those dates to move the same definition to a new term, or keep one report per period so both remain available; either way everyone still opens the same definition.
Next: Excel exports