
Custom reports
Custom Reports is for the reports the standard pages do not give you: your own selection of figures, arranged in your own order, under your own headings.
You reach them from a saved report: open the report, and choose Custom Reports in its action bar. The custom reports you build there are tied to that report’s selection of data, which is what keeps their figures consistent with it.
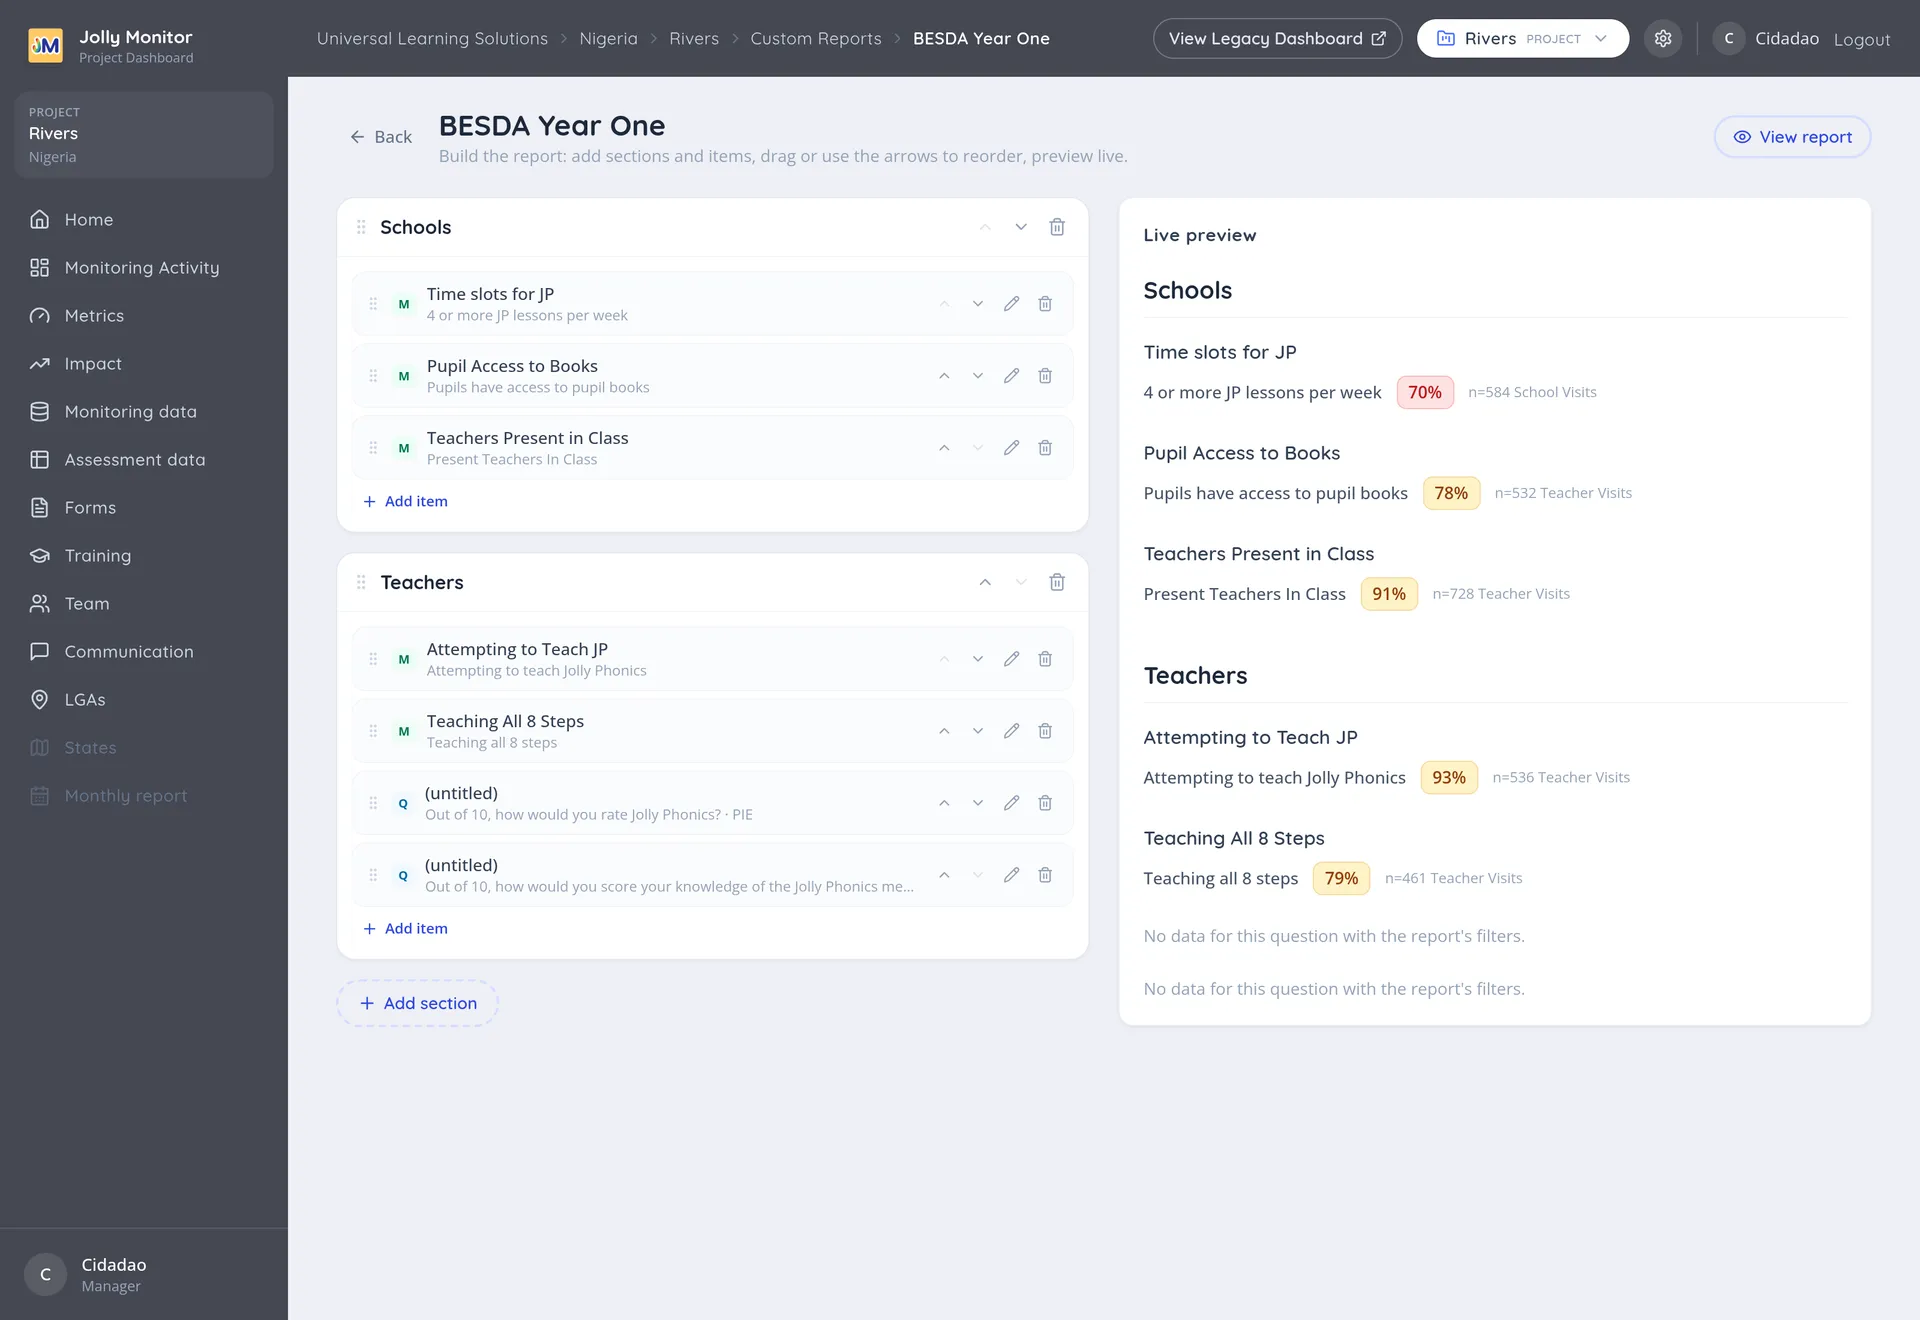
Configuring the report
Section titled “Configuring the report”New report (managers) creates one on the list. Inside it, a report is built from sections (Add section), and each section holds items (Add item, choosing Text, Metric or Monitoring Question).
- A section is a heading that groups things together.
- An item is one thing to show: a metric, or the answers to a monitoring question, or a piece of text.
Both sections and items can be reordered, which is how the report becomes something that reads in a sensible order rather than the order you happened to add things.
Each report is tied to a selection of data, in the same way a saved report is: a period and a scope, so the figures in it are the figures for that period.
Viewing and printing
Section titled “Viewing and printing”A report has a view mode that shows the finished result without the editing controls, with a Print button that opens the browser’s print dialog over a clean, chrome-free copy. That is the version to open in a meeting or to print for somebody who does not use the dashboard.
What custom reports are good for
Section titled “What custom reports are good for”The standard pages answer the questions the system was built around. A custom report answers the questions your programme is asked, which are rarely identical:
- A funder’s quarterly template, with the same figures in the same order every quarter.
- A one-page summary for a ministry meeting, mixing a metric, a question’s answers and a note.
- An internal review that puts training numbers next to the indicators they were meant to move.
Metrics inside a report
Section titled “Metrics inside a report”An item can be a metric, which is why a metric already used in a custom report cannot be deleted: the dashboard refuses and asks you to remove it from the report first. See Creating and editing a metric.
Next: The Data Explorer