
Impact
The Impact section shows how the country is doing against its targets, for both pupils and teachers. Where the other sections report activity, this one reports results.
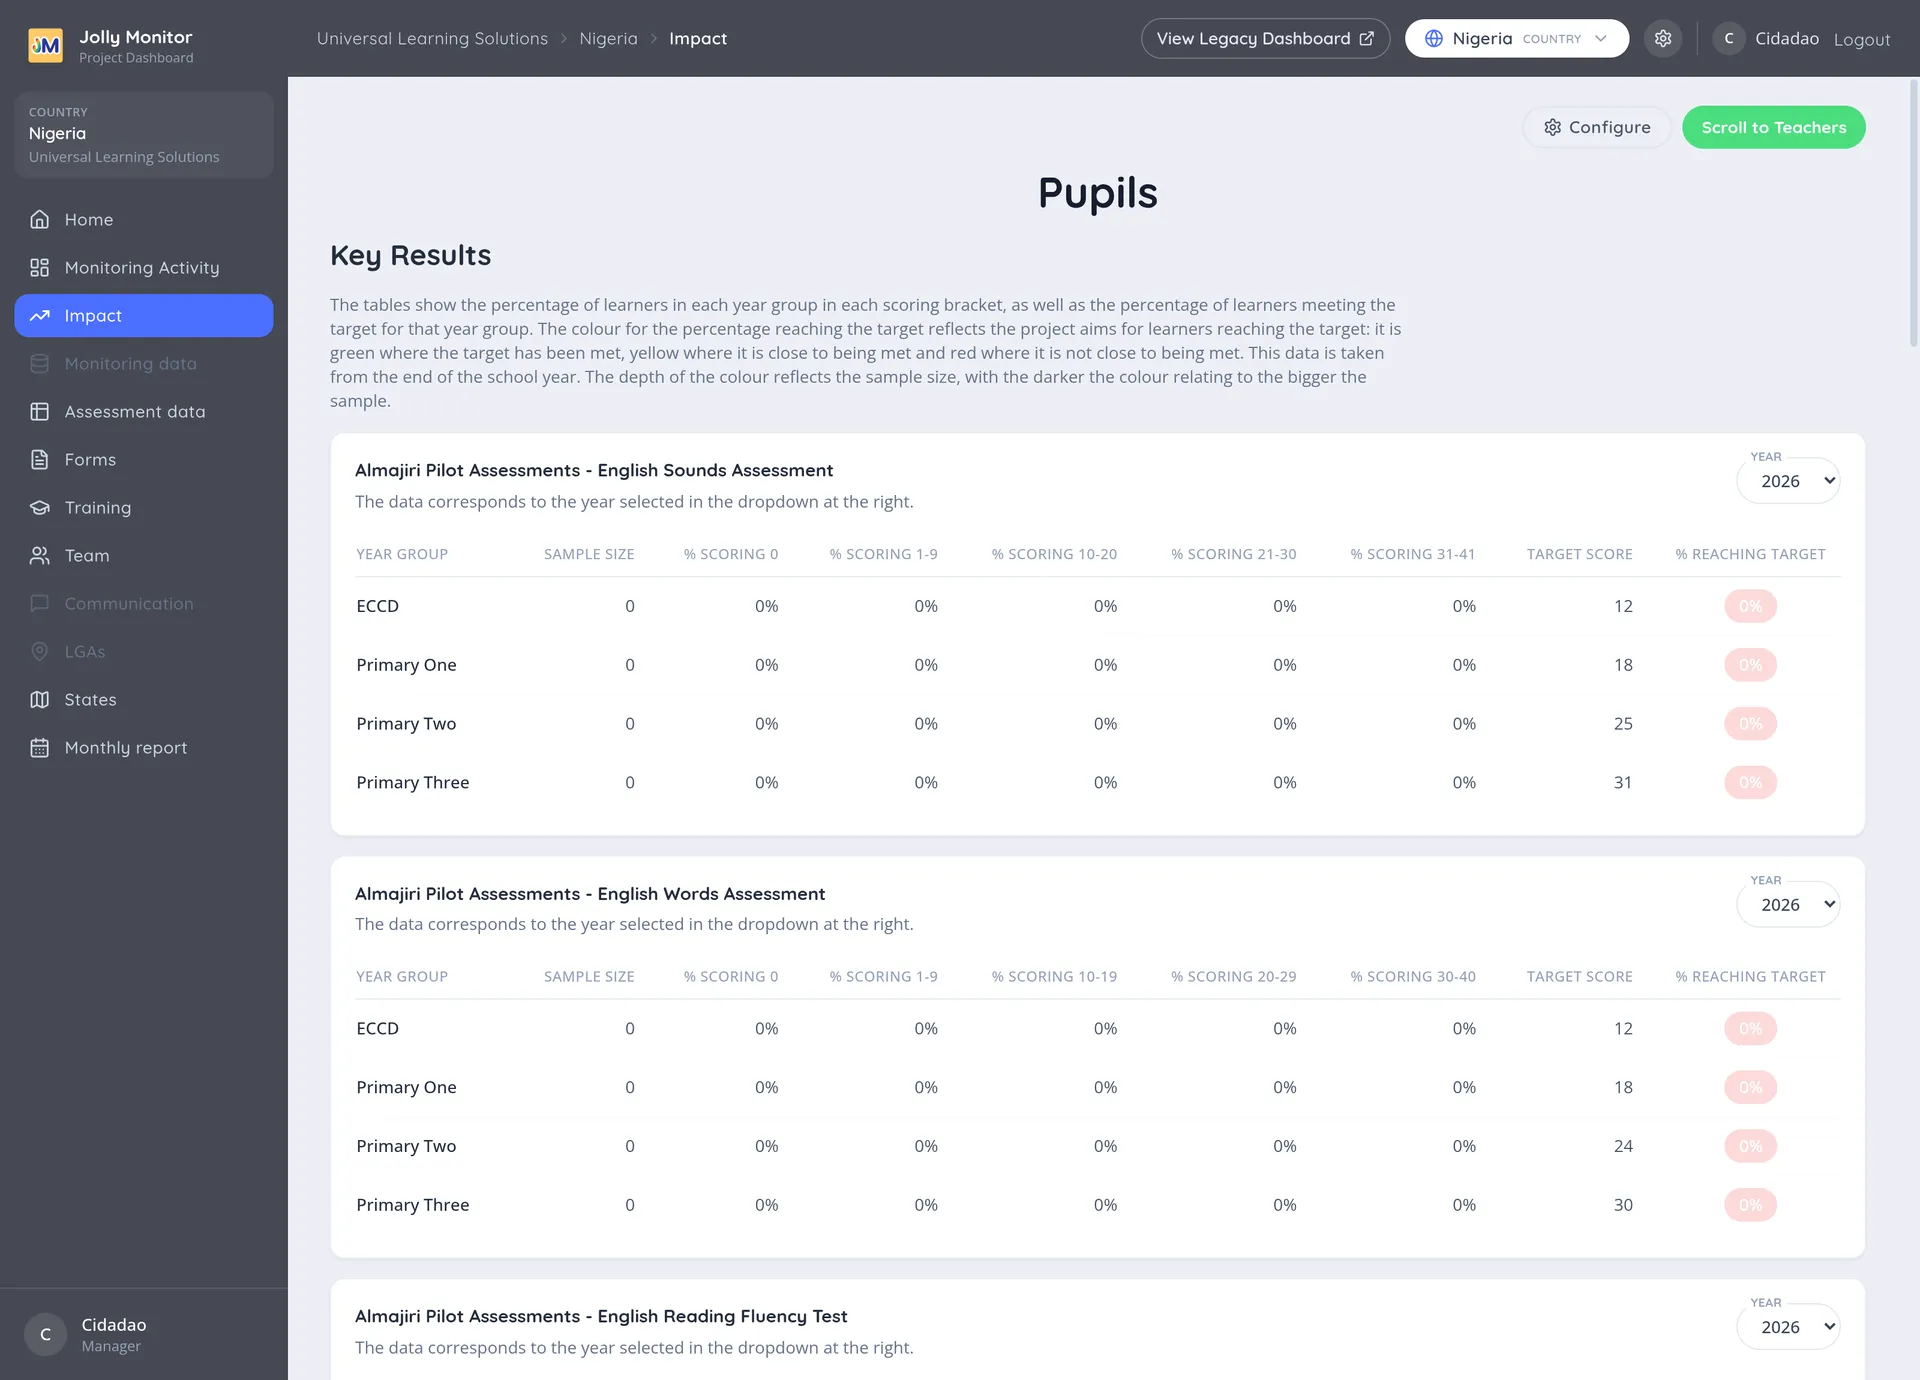
At the top of the page a Scroll to Teachers button jumps straight to the teacher half.
Key Results
Section titled “Key Results”The Key Results section reports pupil results, with one table per assessment set up in the country’s impact configuration. Each table has its own year selector, so you can move between school years without changing the rest of the page.
The page states the rule it follows: the tables show the percentage of learners in each scoring bracket and the percentage meeting the target for that year group, taken from the end of the school year.
Each table has these columns:
| Column | What it shows |
|---|---|
| Year group | The pupils being measured, for example Primary One |
| Sample size | How many results the row rests on |
| % scoring bands | The share of pupils in each score bracket |
| Target score | The score being aimed for in that year group |
| % reaching target | The share of pupils who reached it, coloured |
The score brackets are part of the impact configuration, set per table, which is why different tables can show different bands. See Where the content comes from below.
Reading the colour coding
Section titled “Reading the colour coding”The % reaching target figure is coloured so you can read a table at a glance:
| Colour | Meaning |
|---|---|
| Green | The target has been reached |
| Yellow | Close to the target |
| Red | Far from the target |
Teacher Performance
Section titled “Teacher Performance”Below the pupil tables, the teacher half reports how teachers are doing against their indicators, such as attempting to teach Jolly Phonics, teaching all eight steps, or pupils having access to books.
Breaking results down
Section titled “Breaking results down”The per-district breakdown lives on each project’s Impact page, where every table carries a See Results for Each … link (named with your country’s own word for districts). At country level you drill down by opening a project first.
Where the content comes from
Section titled “Where the content comes from”Which tables appear here, and in what order, is set in the impact configuration. It is reached from the Configure link on the page, shown to administrators, and it manages the Key Results tables: their titles, assessment sections, score brackets and targets.
A project has its own configuration and the country has its own, so the same assessment can be reported differently at the two levels.
Next: Leaderboards