
The Training tab
The project’s Training section records the training events run for this project and how many people they reached.
The period selector
Section titled “The period selector”The period selector applies here as elsewhere, and this page sets itself to All time when opened: training is a long game, so the full history is the default. Narrow it to a term when you need one.
Training key figures
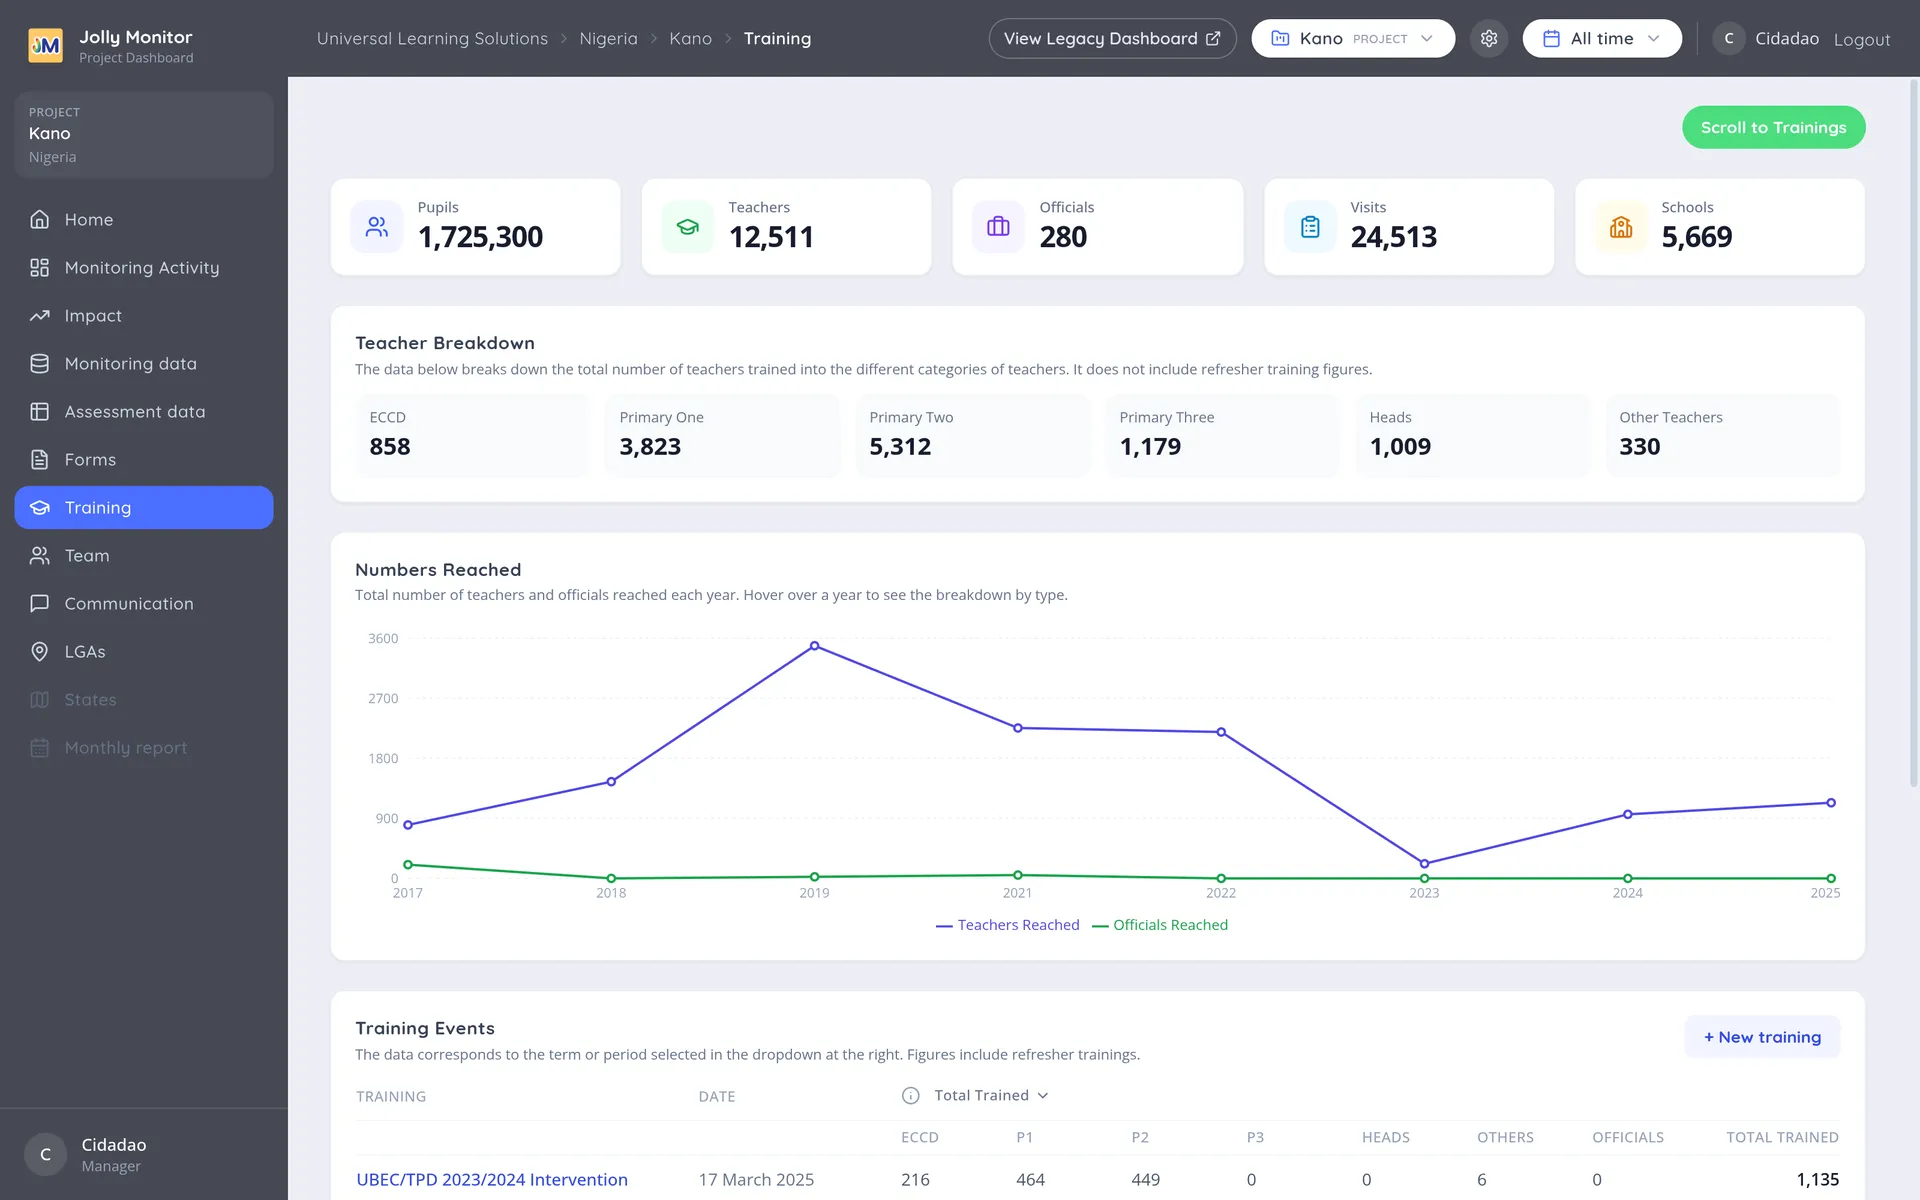
Section titled “Training key figures”Five figures head the page: Pupils, Teachers, Officials, Visits and Schools, the project’s reached-and-covered totals for the period.
Below them, the Teacher Breakdown shows the teachers trained per category (ECCD, that is early-childhood classes, then Primary One, Primary Two, Primary Three, Heads and Other Teachers). As its note says, it does not include refresher trainings, so it reads as people reached rather than attendances.
Numbers Reached
Section titled “Numbers Reached”A chart of how many teachers and officials the training reached each year. It ignores the period selector on purpose, because its job is the long view: which years had a big rollout and which went quiet.
The trainings table
Section titled “The trainings table”Each row is an event with its date and its Total trained, expanding into the category columns plus an Officials column the teacher breakdown above does not carry. Click an event to open it.
Recording a training
Section titled “Recording a training”New training (senior managers) creates an event. Once it exists, open it to:
- Add participants individually, or import a list.
- Record aggregate figures per category, which is what the event reports as its numbers.
Training and the rest of the programme
Section titled “Training and the rest of the programme”Training figures sit apart from monitoring figures on purpose: training is what you put in, monitoring is what you observe afterwards. Read together they answer the question that matters, which is whether the training changed anything in the classroom.
The teacher indicators on the Impact page are the other half of that pair. A project with high training numbers and flat indicators is training people who are not yet applying it, which is a different problem from not having trained them at all.
Next: Project leaderboards