
The Data Explorer
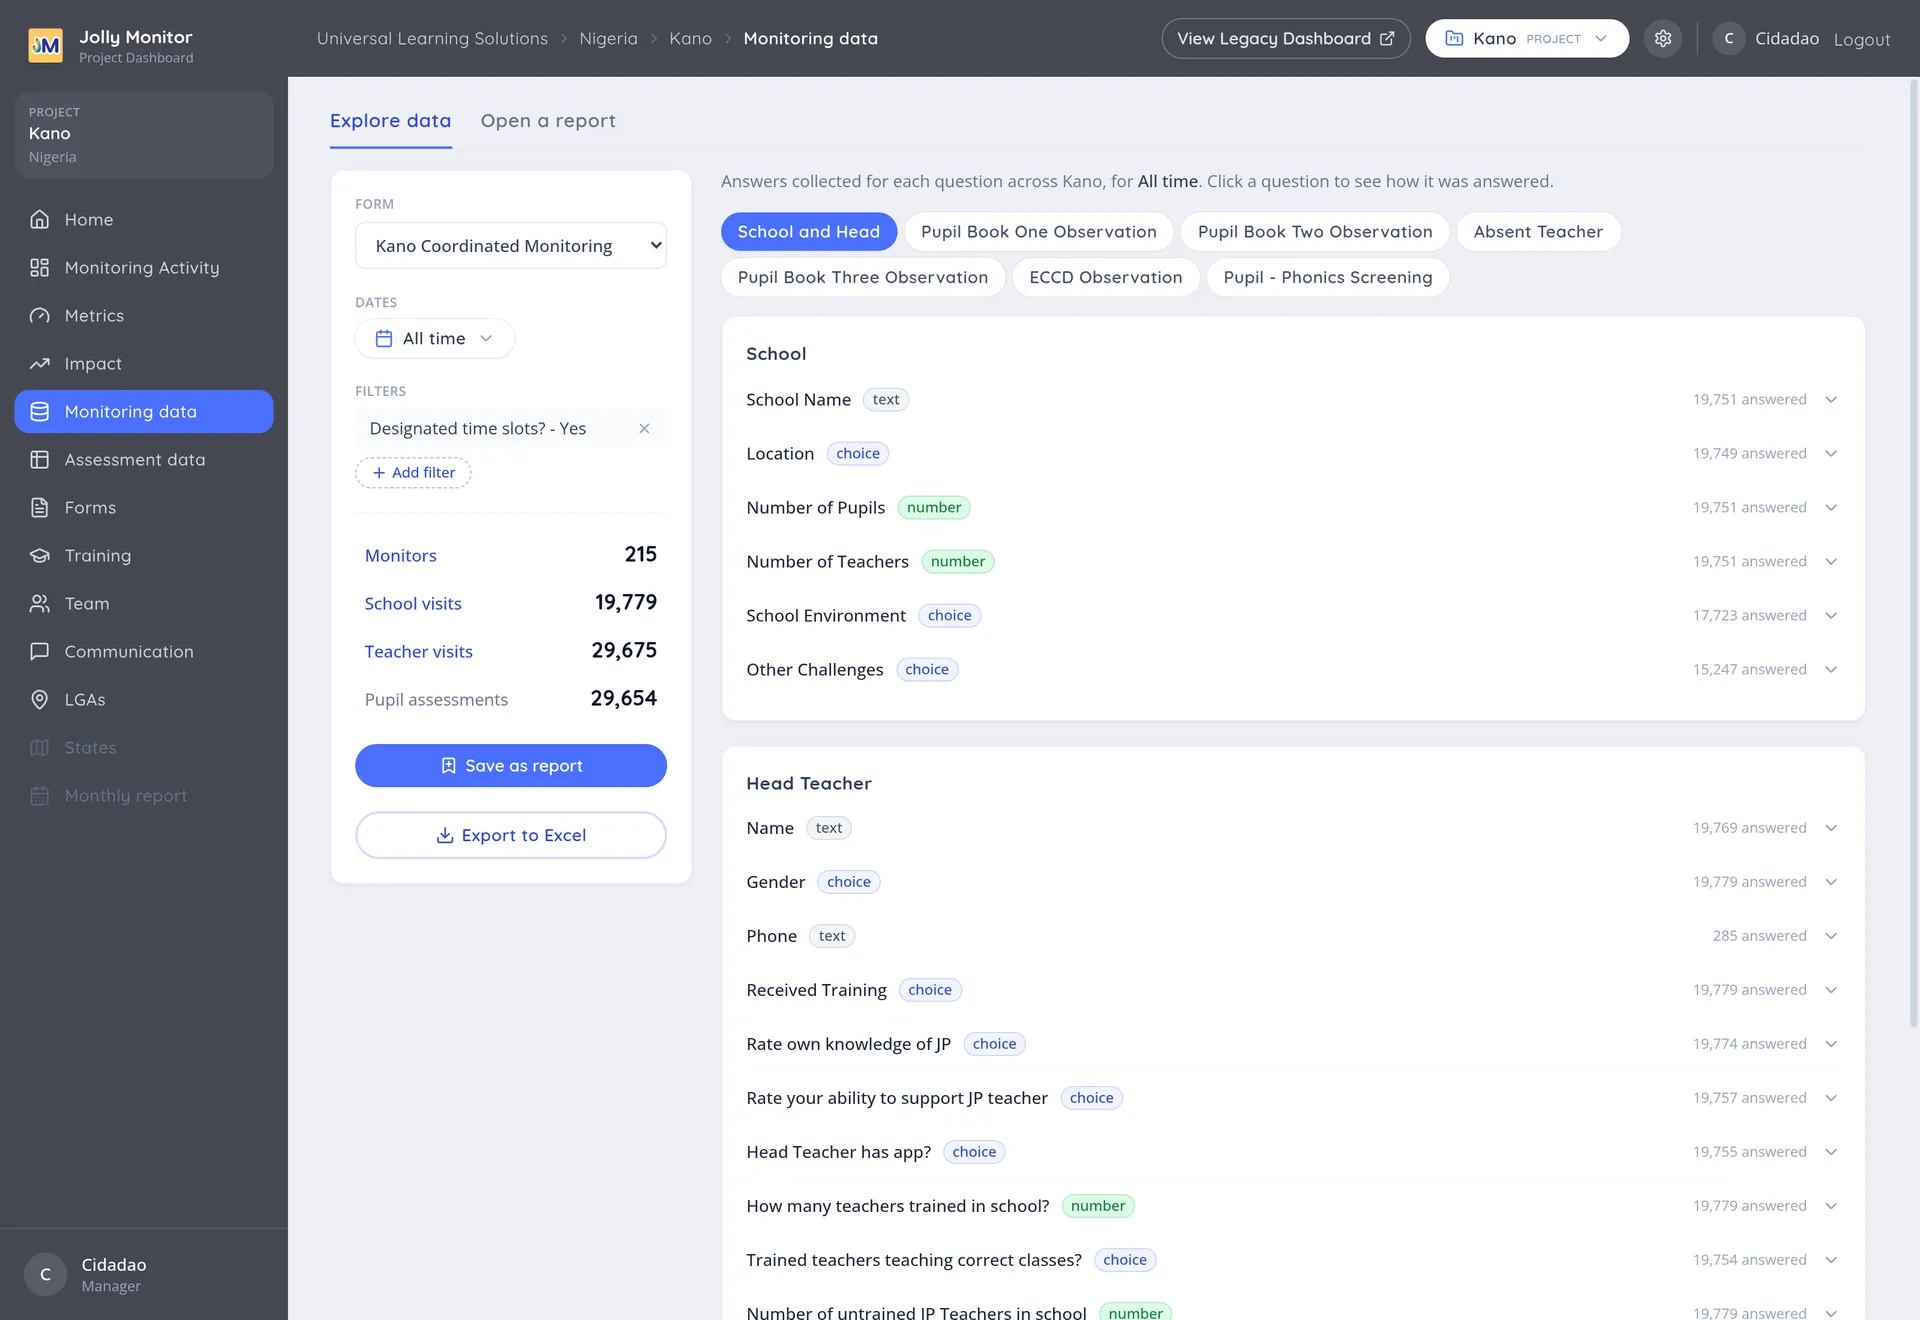
The Data Explorer is the Explore data side of a project’s Monitoring data section. It is where you ask questions of the answers your monitors collected, rather than reading a prepared page.
Building a view
Section titled “Building a view”Two choices define what you are looking at:
- Form: which of the project’s monitoring forms. Internal evaluation forms are listed here too.
- Dates: the period, from the standard selector: a term, a whole year, All time, or your own start and end dates.
The counters
Section titled “The counters”A row of counters summarises the selection: Monitors, School visits, Teacher visits and Pupil assessments.
The questions
Section titled “The questions”Below the counters, the form’s questions appear grouped by the part of the visit they belong to, such as School and Head, Head Teacher, or the pupil assessments. Each question shows its answer type and how many answers it collected.
Clicking a question opens how it was answered: the distribution across its options, or the values collected for a free-text or numeric question.
A question with zero answers in a period that clearly had monitoring is itself a finding. It usually means the question was added to the form after that period, or that monitors are skipping it.
Filters
Section titled “Filters”Beyond the form and the period, the explorer can narrow to the visits that match content filters: conditions on the answers themselves, such as only visits where a particular option was chosen.
Add filter under the Dates selector opens a dialog with four filter types:
- School visit: a single-choice question answered about the school, and the answer that must have been selected.
- Teacher visit: the same, for a question answered during a teacher observation.
- Pupil assessment: the same, for a question answered about a pupil.
- Training: only visits to teachers who participated in the chosen training.
Each filter appears as a small entry in the sidebar with an x to remove it. A visit must match every filter listed, and everything on the page follows: the counters, each question’s answers, and the drill-down lists. Filters are yours alone: they live with your own explorer, not the project’s.
Only single-choice questions can be filtered on, because a filter is “this answer was selected”. On a large form the filtered numbers can take noticeably longer to compute.
Saving a report
Section titled “Saving a report”Save as report (managers) stores the current form, period and filters under a name. It then appears under Open a report for anybody working on the project, where its filters are listed read-only; a report with none says “This report has no filters applied.”
This is what turns a piece of analysis into something repeatable, and it is the difference between answering a question once and being able to answer it again next term.
Next: Saved reports