
Monthly report
The Monthly report gives you one month of a country at a glance. It is the page to open when somebody asks how last month went, and it is compact enough to pass on as it is.
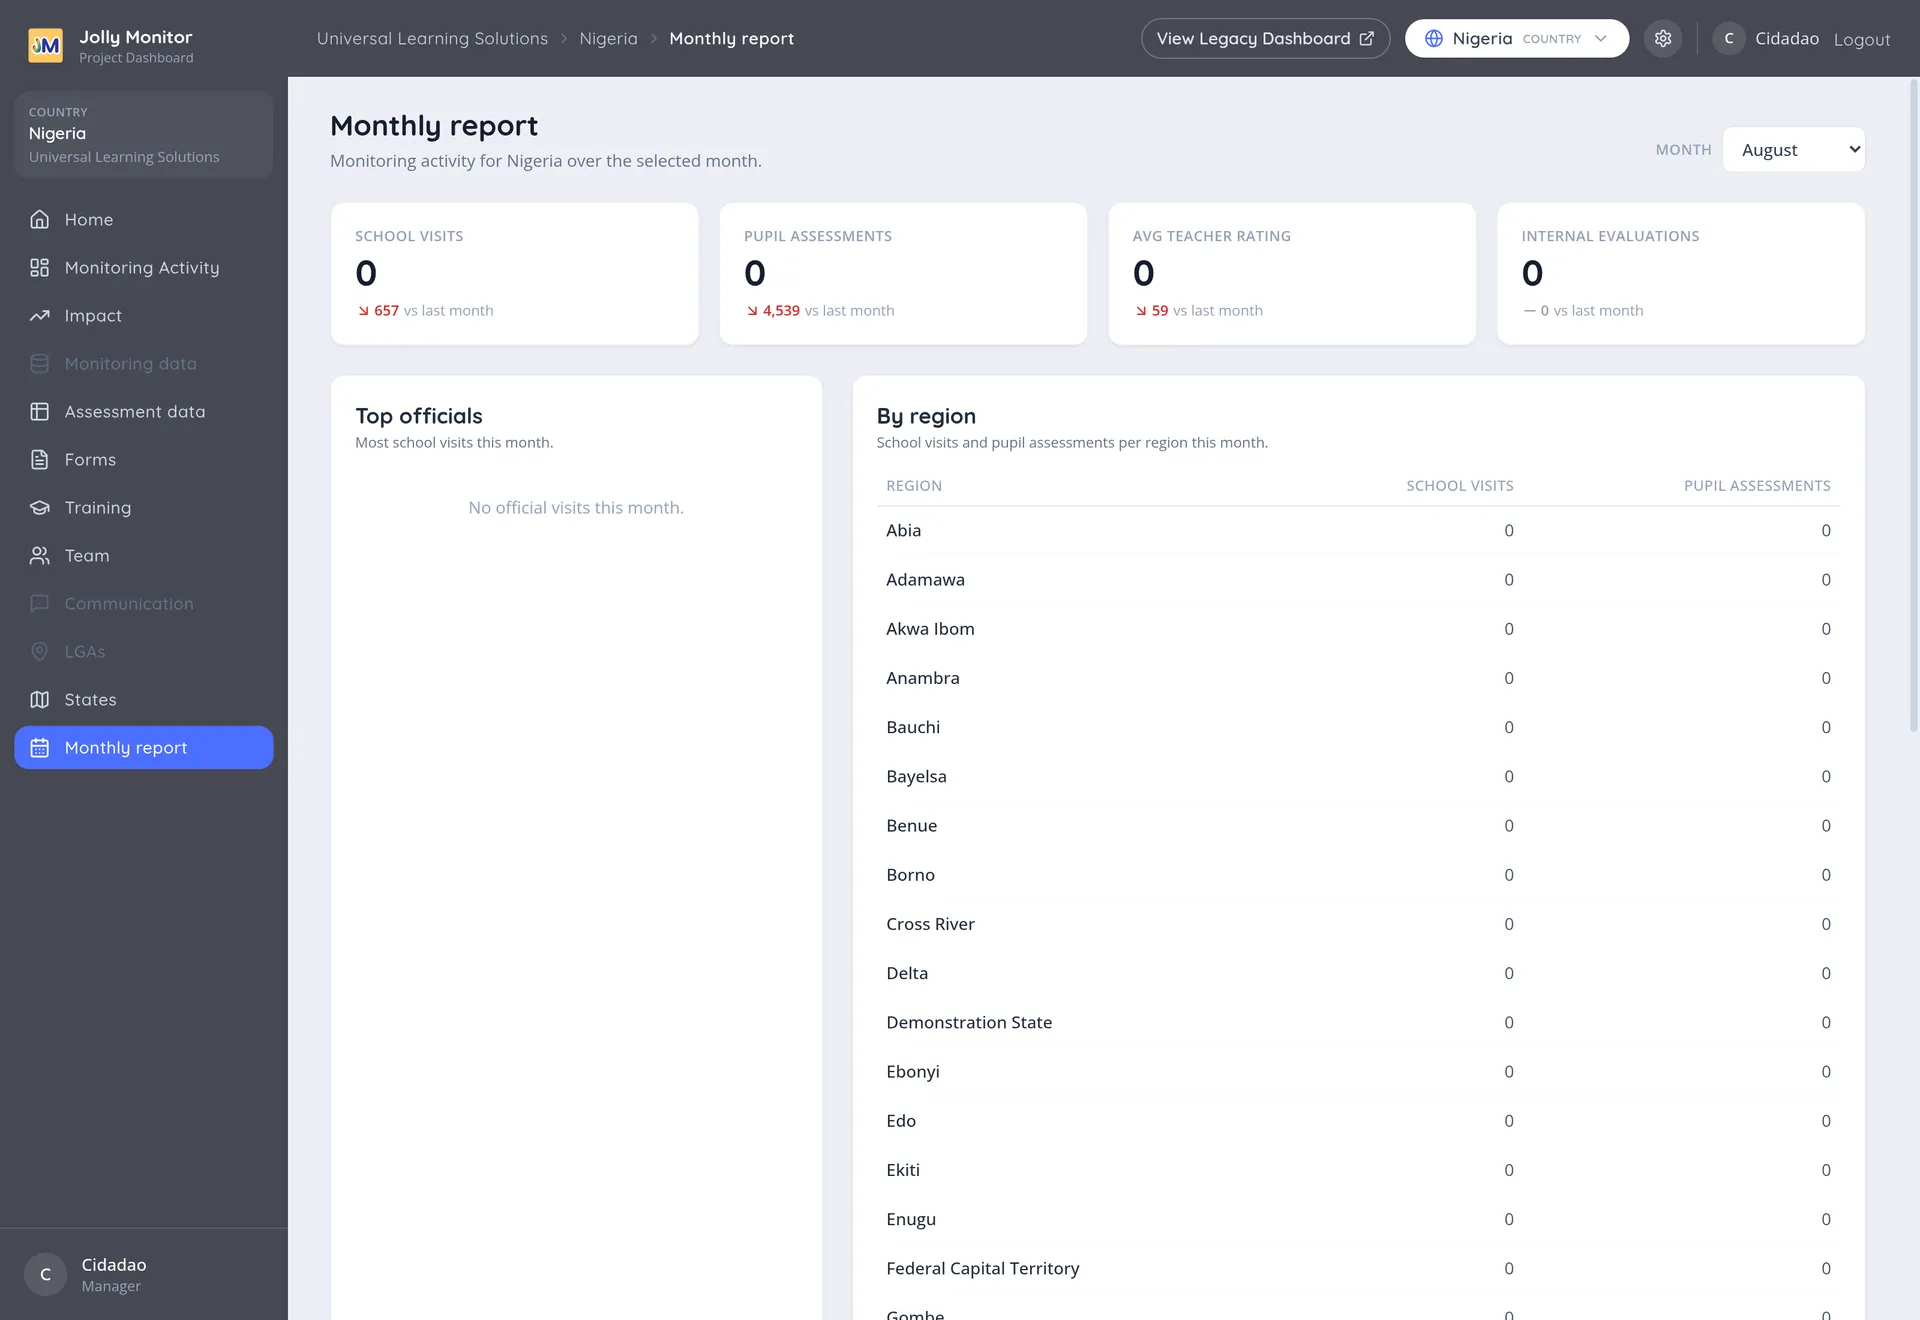
The month selector
Section titled “The month selector”A Month dropdown at the top picks the month. Everything on the page reloads for the month you choose.
The selector always covers the last twelve months: a month that has already started this year is shown for this year (the month under way included), and a month still to come is shown for last year. Picking December in August, for example, shows last December. There is no way to go further back than a year from here.
The figure cards
Section titled “The figure cards”Across the top are cards summarising the month:
| Card | What it shows |
|---|---|
| School visits | Visits recorded that month |
| Pupil assessments | Assessments recorded that month |
| Avg teacher rating | The average rating monitors gave the teachers they observed |
| Internal evaluations | Evaluations carried out by schools themselves |
Each card carries the change against the month before, an arrow with the difference labelled vs last month. That comparison is the point of the page: a figure on its own says little, while the movement against last month tells you whether things are picking up or slipping.
Top officials
Section titled “Top officials”A table ranks the officials who recorded the most activity that month. This is the section people usually want for recognition, or for a conversation with whoever has gone quiet.
By region
Section titled “By region”A table reports the month region by region, with School visits and Pupil assessments per region. It is the quickest way to see which parts of the country were active and which were not.
Because the table lists every region, including those with zero activity, it doubles as a coverage check: a long run of zeros is a coverage problem, not a reporting one.
A note on timing
Section titled “A note on timing”The report follows the calendar month, not the term. A month that straddles a term break will look thinner than the term itself did, so compare like with like when you use these figures in a narrative.
Next: Country configuration