
The Assessment data tab
Assessment data is where pupil assessment results are gathered into something you can read: reports made of sample groups, and comparisons that put those groups side by side.
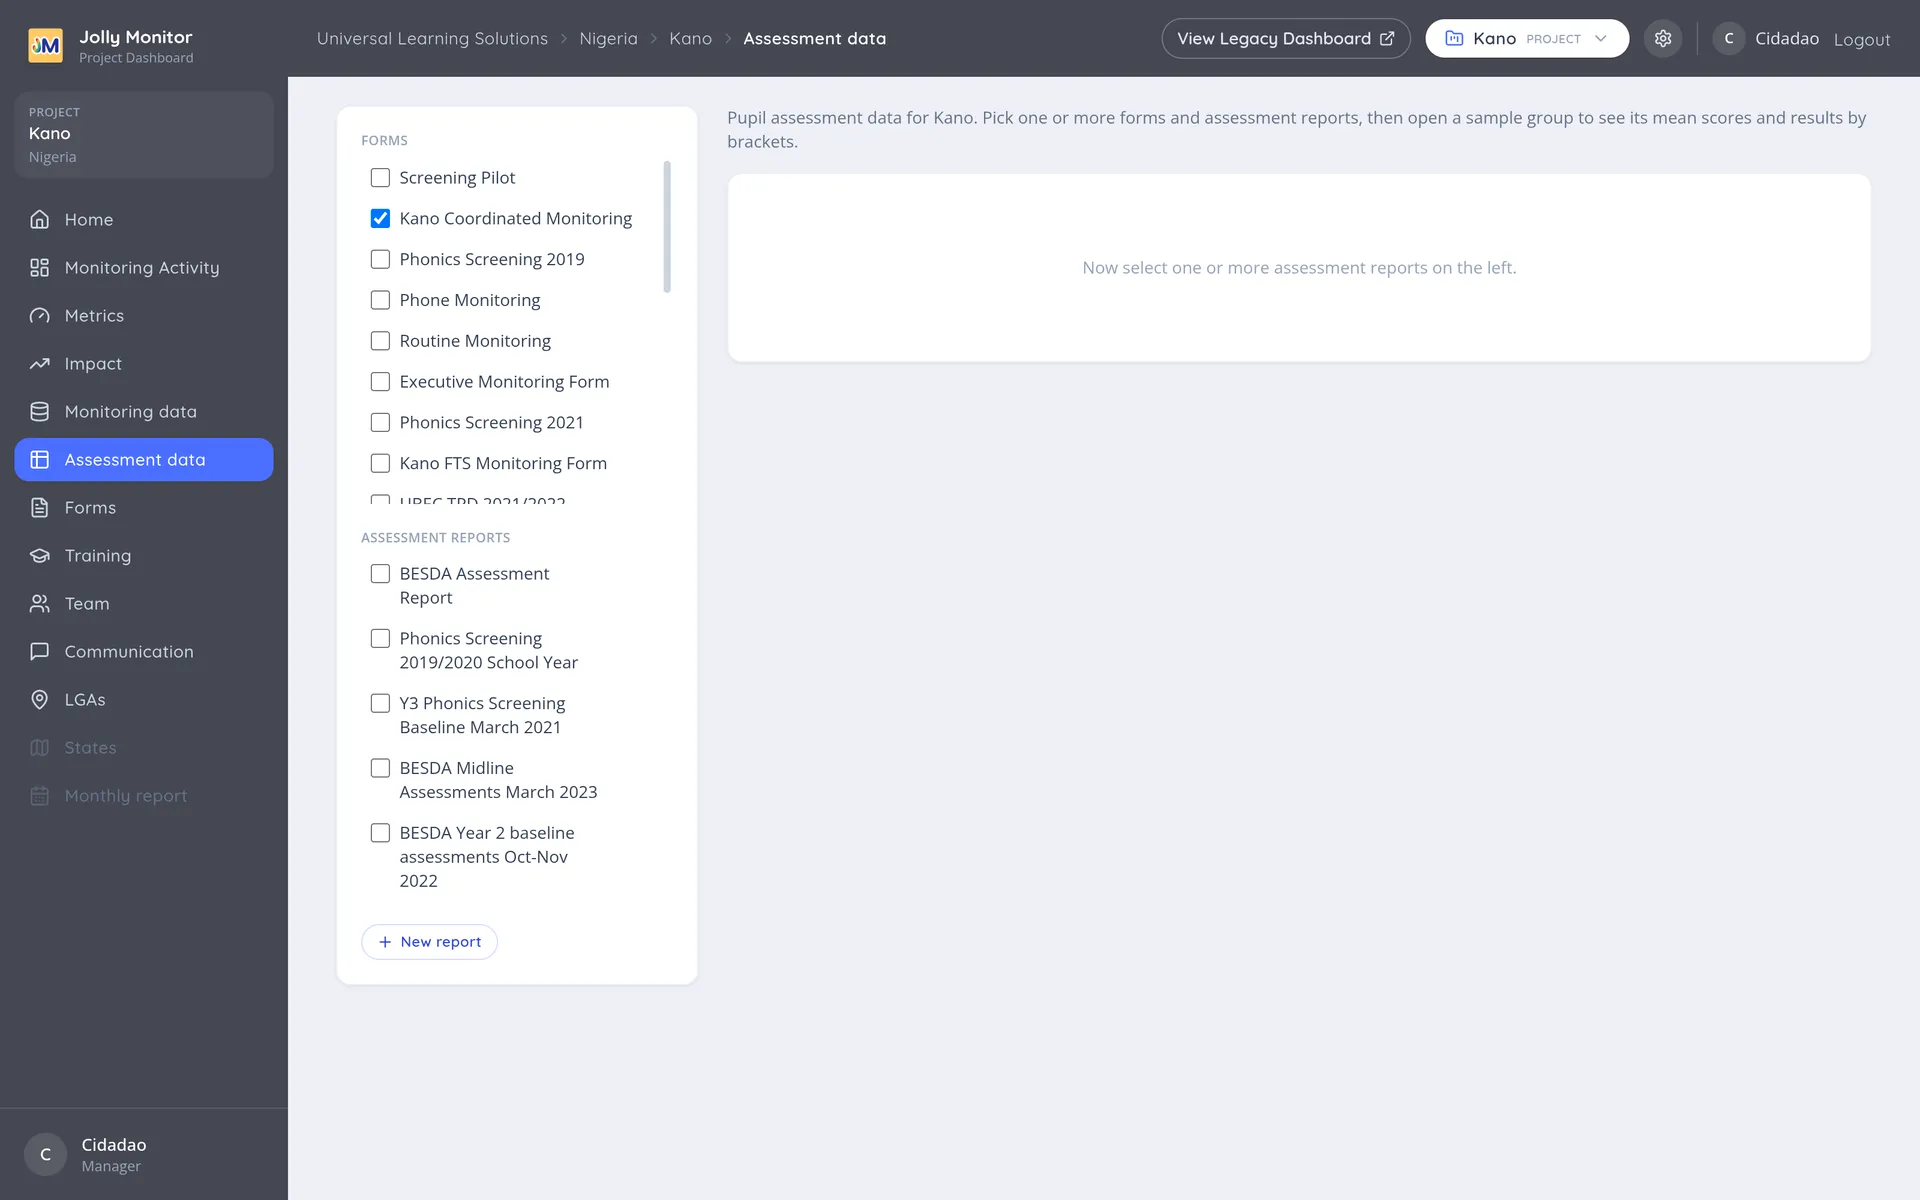
Reports
Section titled “Reports”A report collects the results you want to look at together. New report (managers) creates one, and opening a report is where the rest of the work happens.
Sample groups
Section titled “Sample groups”Inside a report, results are organised into sample groups. A sample group is a defined set of pupils: from a chosen period, in a chosen place, assessed with a chosen assessment. The dashboard averages their scores and shows how they are distributed.
The sample size is part of the finding, not a footnote. A difference between two groups of thirty pupils means much less than the same difference across three hundred.
Comparisons and splits
Section titled “Comparisons and splits”- A comparison places two or more sample groups side by side. The common uses are the same year group at the start and the end of a year, or a project’s schools against schools without the programme.
- A disaggregation breaks one group down by a characteristic, such as school, district or a question’s answer, which is where an average that looked fine often turns out to hide two very different groups. (Inside a comparison, a Splits comparison chart shows the compared groups per score bracket, a different view.)
Getting the data out
Section titled “Getting the data out”A sample group downloads as a spreadsheet, and a whole report can be exported, including the pupil level detail. That matters for anybody who needs to redo the analysis independently.
Where to go for the detail
Section titled “Where to go for the detail”This is a detailed area with its own tools. For how to build and read sample groups, see Sample groups and assessment data.
Next: The Communication tab