
The Impact tab
A project’s Impact page reports results rather than activity: what pupils can do, and what teachers are doing in the classroom.
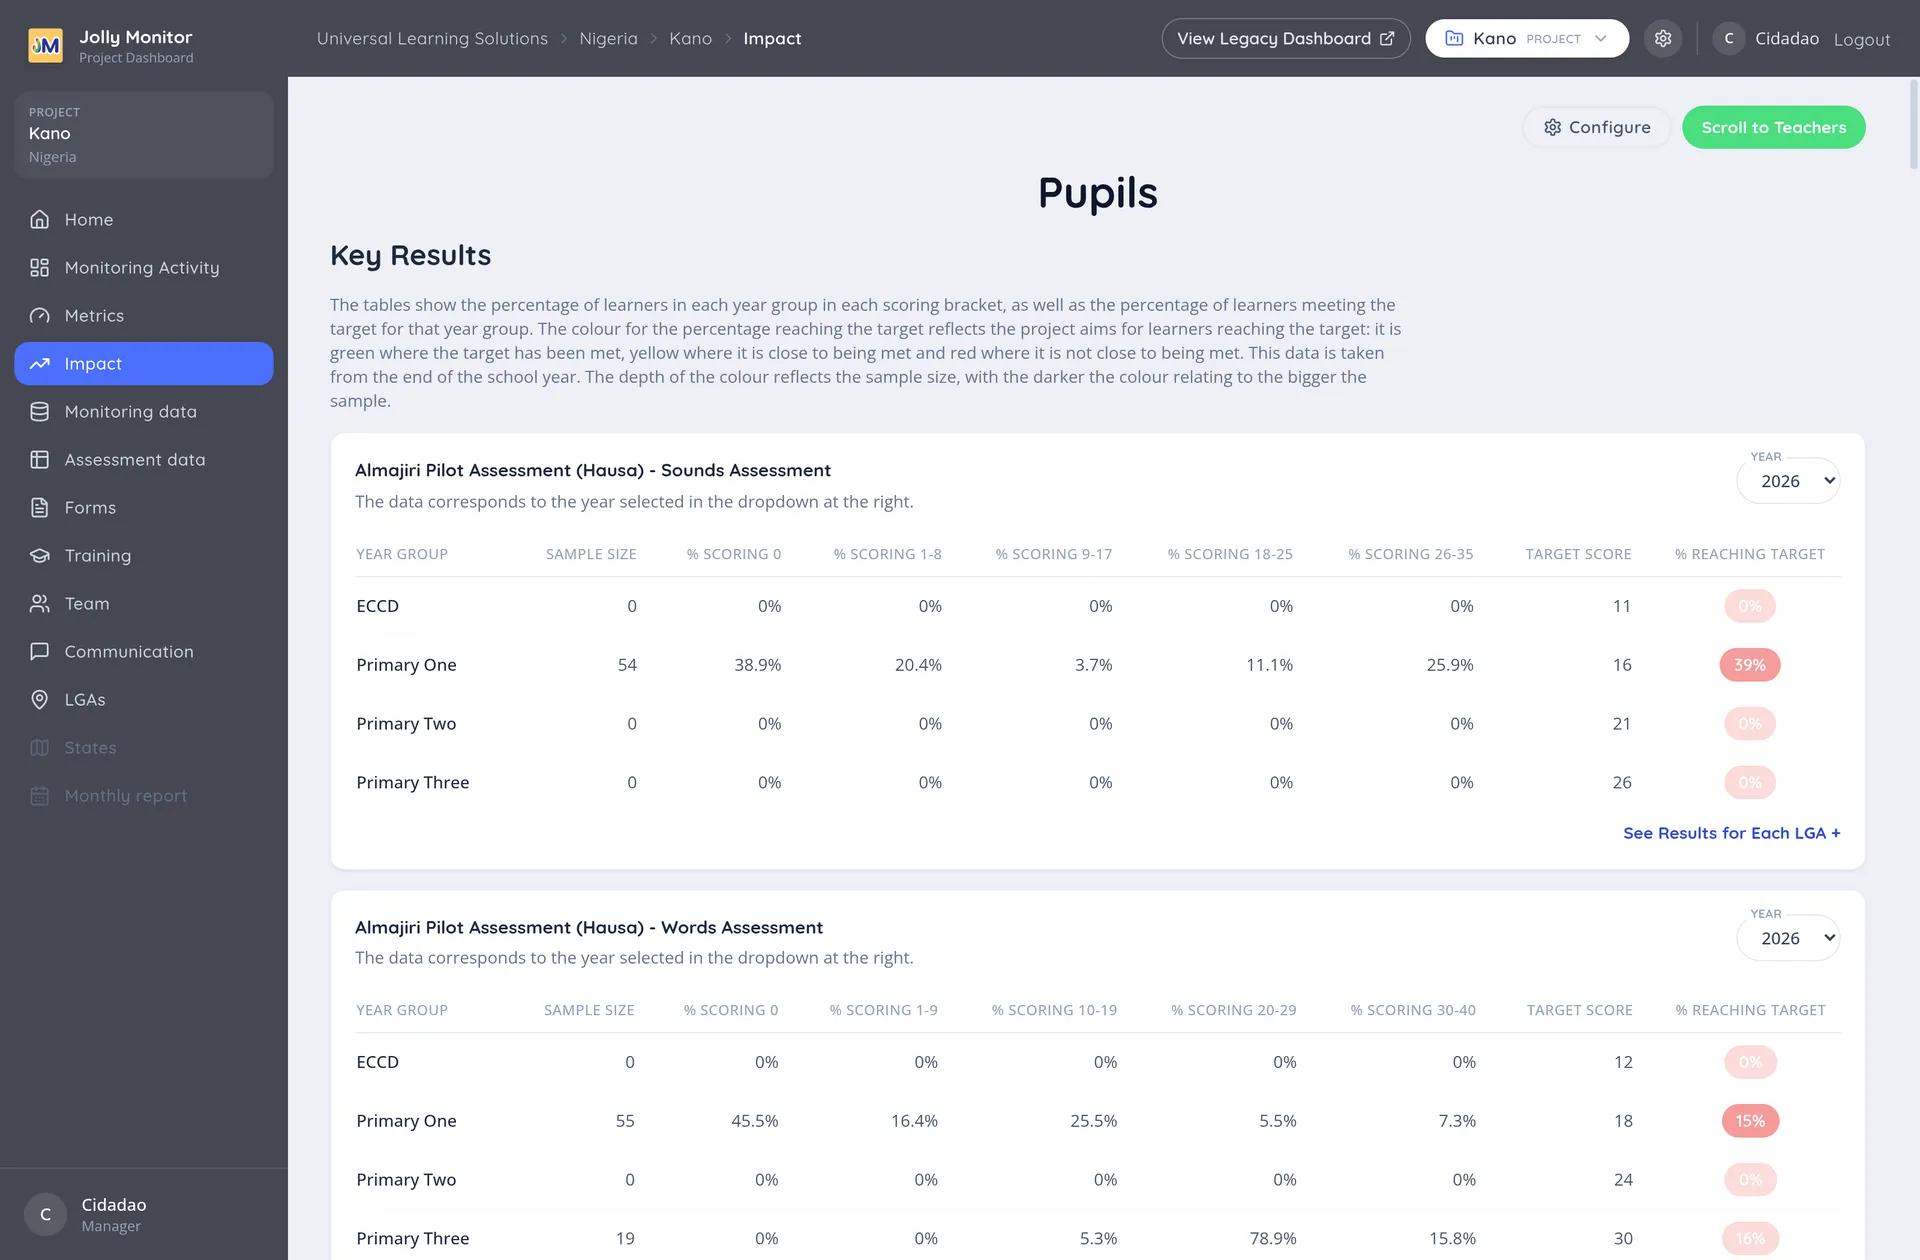
It reports the same Key Results as the country page, and adds a section the country level does not have: Results Over Time.
Key Results
Section titled “Key Results”One table per assessment, each with its own year selector. The columns are the same as at country level: the year group, the sample size, the percentage in each score bracket, the target score and the percentage reaching it.
See Impact for how to read the tables and their colour coding, which works identically here.
Scroll to Teachers jumps to the teacher half of the page.
Results Over Time
Section titled “Results Over Time”The project page adds a Results Over Time section, which plots the same measures across successive periods. This is where change becomes visible: a single snapshot tells you where you are, while the trend tells you whether the work is landing.
Teacher Performance
Section titled “Teacher Performance”Below the pupil tables, the teacher indicators report what monitors observed in classrooms. Typical ones are:
- Attempting to teach Jolly Phonics
- Teaching all 8 steps
- Pupils have access to pupil books
- 4 or more lessons per week
These come from the project’s metrics, so they are the same numbers as the Metrics page, presented as impact.
Results for each district
Section titled “Results for each district”Each table carries a See Results for Each … link, named with your country’s own word for districts. It opens the same results broken down district by district.
How a result gets onto this page
Section titled “How a result gets onto this page”The chain behind a single percentage is worth knowing, because it explains why a table is sometimes empty:
- A monitor assesses pupils during a visit, using a pupil form that points at an assessment definition (the form hierarchy is covered in Monitoring forms).
- The scores are recorded per assessment section.
- The impact configuration decides which sections appear here, in what order, and with which score brackets.
- The page groups the results by year group and compares them against the target score.
If a table shows zeros with a sample size of 0, the break is at step 1: no pupils in that year group were assessed in the selected year. If a section you expect is missing entirely, the break is at step 3.
Impact Configuration
Section titled “Impact Configuration”What appears on this page is set in the impact configuration, reached from the Configure link, shown to administrators. It lets you choose the assessment sections and the indicators that make up Key Results.
A project has its own configuration, and the country has its own, so the same assessment can be reported differently at the two levels. Beside Save, administrators also get a separate Save for all projects button, which overwrites the configuration of every project in the country with this one after its own confirmation; there is no undo for that, so read the confirmation carefully. A district’s Impact page has its own configuration too, edited from the district.
Next: The Monitoring data tab