
The Monitoring data tab
Monitoring data is the tool for exploring the monitoring forms your monitors have submitted. It exists at project level only, because it works on one project’s forms.
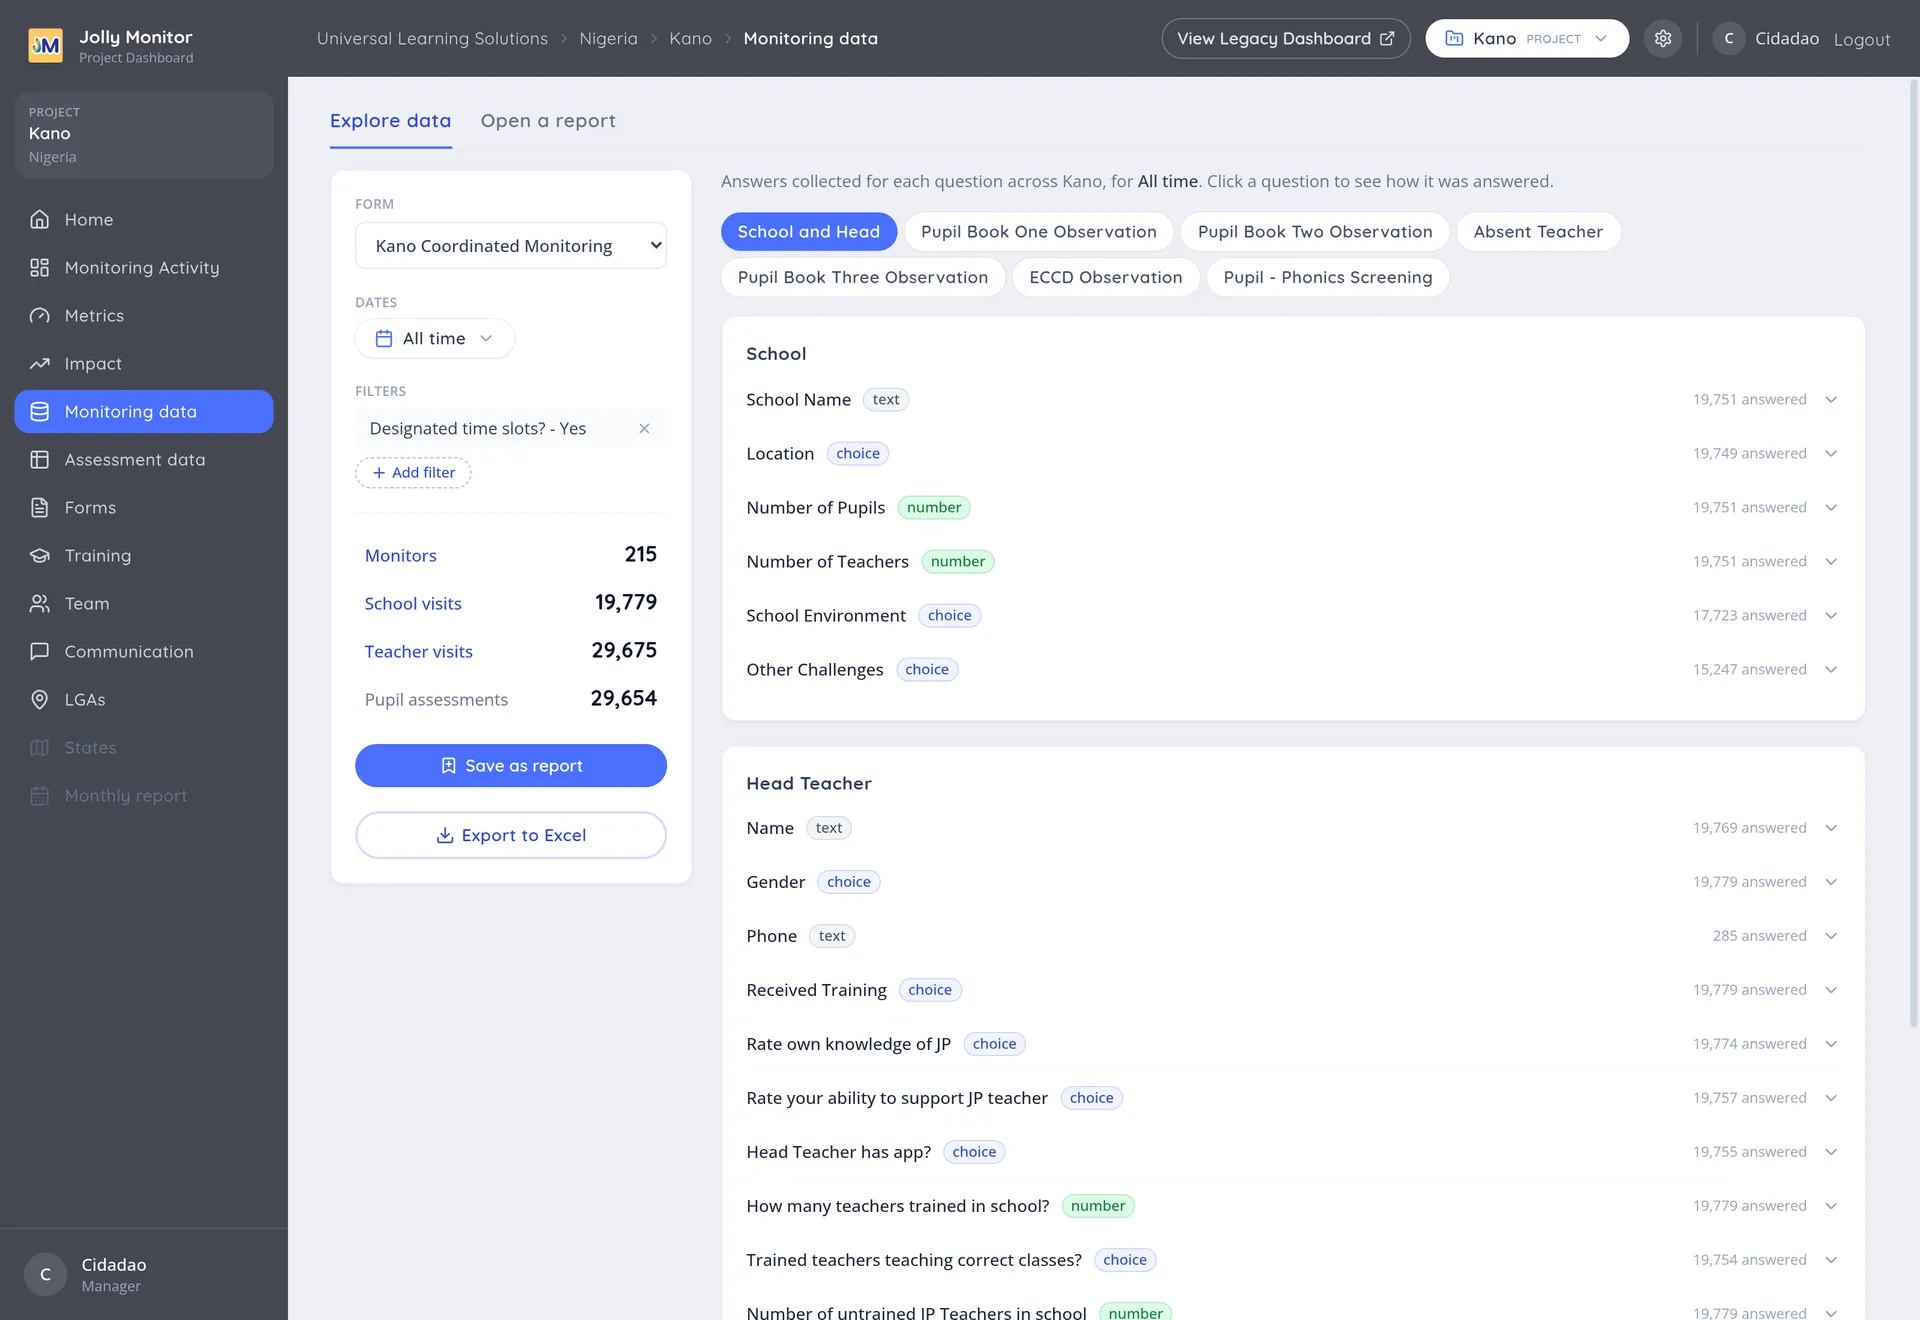
The two ways in
Section titled “The two ways in”The page opens with two tabs:
- Explore data: build a view yourself.
- Open a report: reopen a view somebody already saved.
Explore data
Section titled “Explore data”Building a view takes two choices:
- Form: the project’s monitoring forms are listed by name. Internal evaluation forms appear here too.
- Dates: the period, from the standard selector: a term, a whole year, All time, or your own start and end dates.
A row of counters then summarises what is in your selection:
- Monitors
- School visits
- Teacher visits
- Pupil assessments
Below the counters, the form’s questions are listed grouped by the part of the visit they belong to, such as School and Head, Head Teacher or the pupil assessments. Each question shows its answer type and how many answers it collected. Clicking a question opens how it was answered.
Save as report
Section titled “Save as report”Once you have a view worth keeping, Save as report (managers) stores it under a name. It then appears under Open a report, for you or for anybody else working on the project.
This is what turns a piece of analysis into something repeatable: the same form, the same questions and the same period, reopened next term and compared.
Export to Excel
Section titled “Export to Excel”Export to Excel downloads the current view as a spreadsheet, so the analysis can continue outside the dashboard.
Where to go for the detail
Section titled “Where to go for the detail”This page shares the explorer used elsewhere in the dashboard. For the step by step, see:
- The Data Explorer for building and filtering a view.
- Saved reports for reopening and managing them.
- Excel exports for what the spreadsheet contains.
Next: The Assessment data tab