
Country trainings
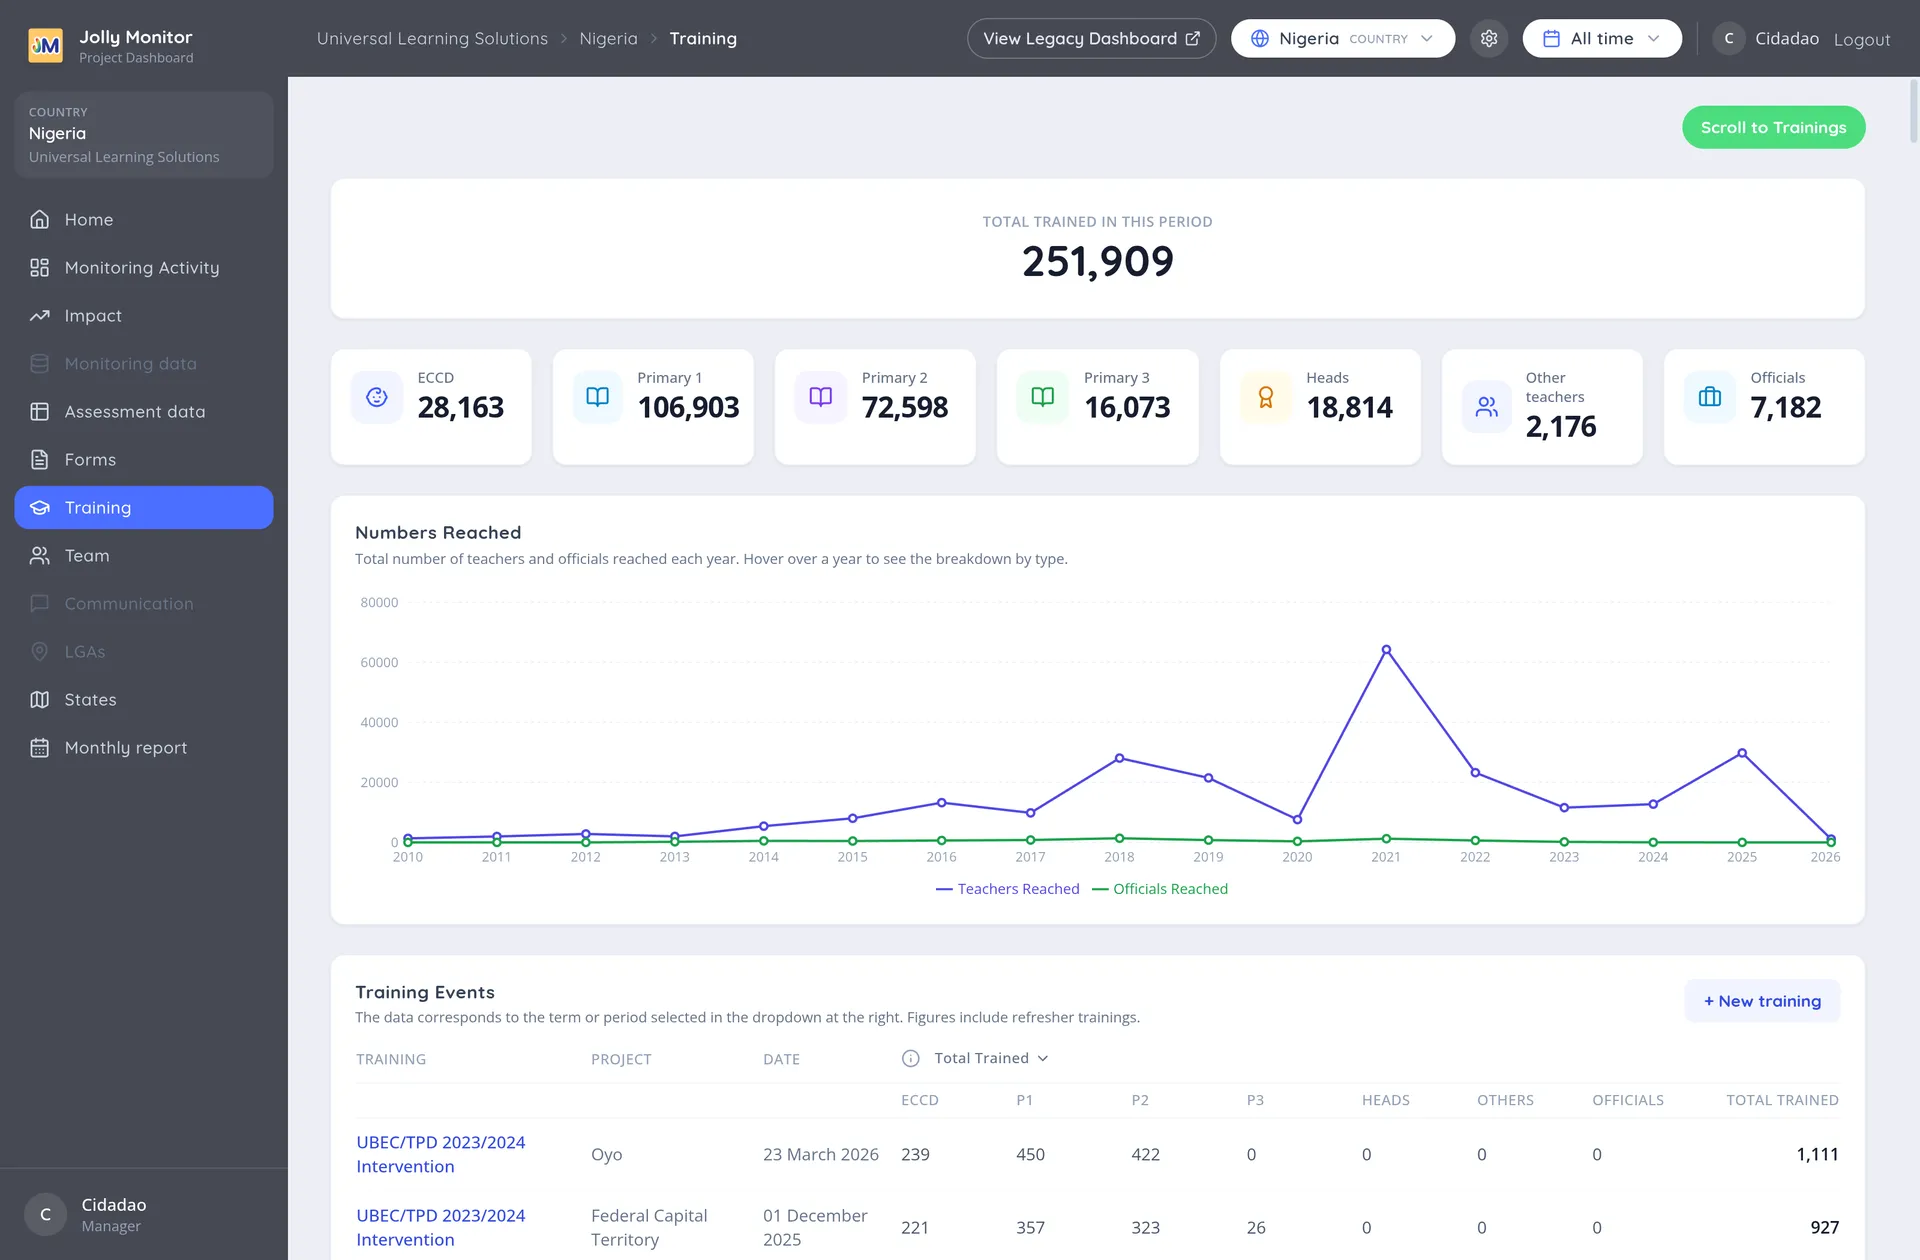
The Training section reports the training delivered across the country: how many people it reached, of which kinds, and which events made it up.
The period selector
Section titled “The period selector”The period selector at the top defaults to All time. Narrow it to a term or a year and the figures, the breakdown and the table all reload for that period.
The Numbers Reached chart is the exception: it always shows per-year totals across every year, because its whole purpose is the long view.
Total trained and the category breakdown
Section titled “Total trained and the category breakdown”Total trained in this period is the headline figure, with the breakdown beside it:
- ECCD
- Primary 1
- Primary 2
- Primary 3
- Heads
- Other teachers
- Officials
Numbers Reached
Section titled “Numbers Reached”The Numbers Reached chart plots how many teachers and officials the training reached each year. Hovering over a year shows the breakdown by type.
Because it ignores the period selector, it is the right place to look for the shape of a programme over its lifetime: the year a big rollout happened, the years that went quiet.
Training Events
Section titled “Training Events”The table lists each event, with:
| Column | What it shows |
|---|---|
| Training | The event, a link to its details |
| Project | Which project ran it |
| Date | When it took place |
| Total trained | How many people, expanding into the category columns |
The Total trained column expands into the same categories as the breakdown above, so you can see the composition of a single event as well as of the whole period.
Adding a training
Section titled “Adding a training”New training (senior managers) creates an event. Once it exists you can open it to add participants, either individually or by importing a list, and to record the aggregate figures per category. The figures on this page are built from the aggregates, not from the participant lists, so record them for every event; an event with named participants but no aggregates contributes zero to the totals.
Scroll to Trainings jumps from the figures down to the table.
Next: Monthly report