
Project leaderboards
A project’s Monitoring Activity page carries three rankings, which together answer “where is the work happening, and who is doing it”.
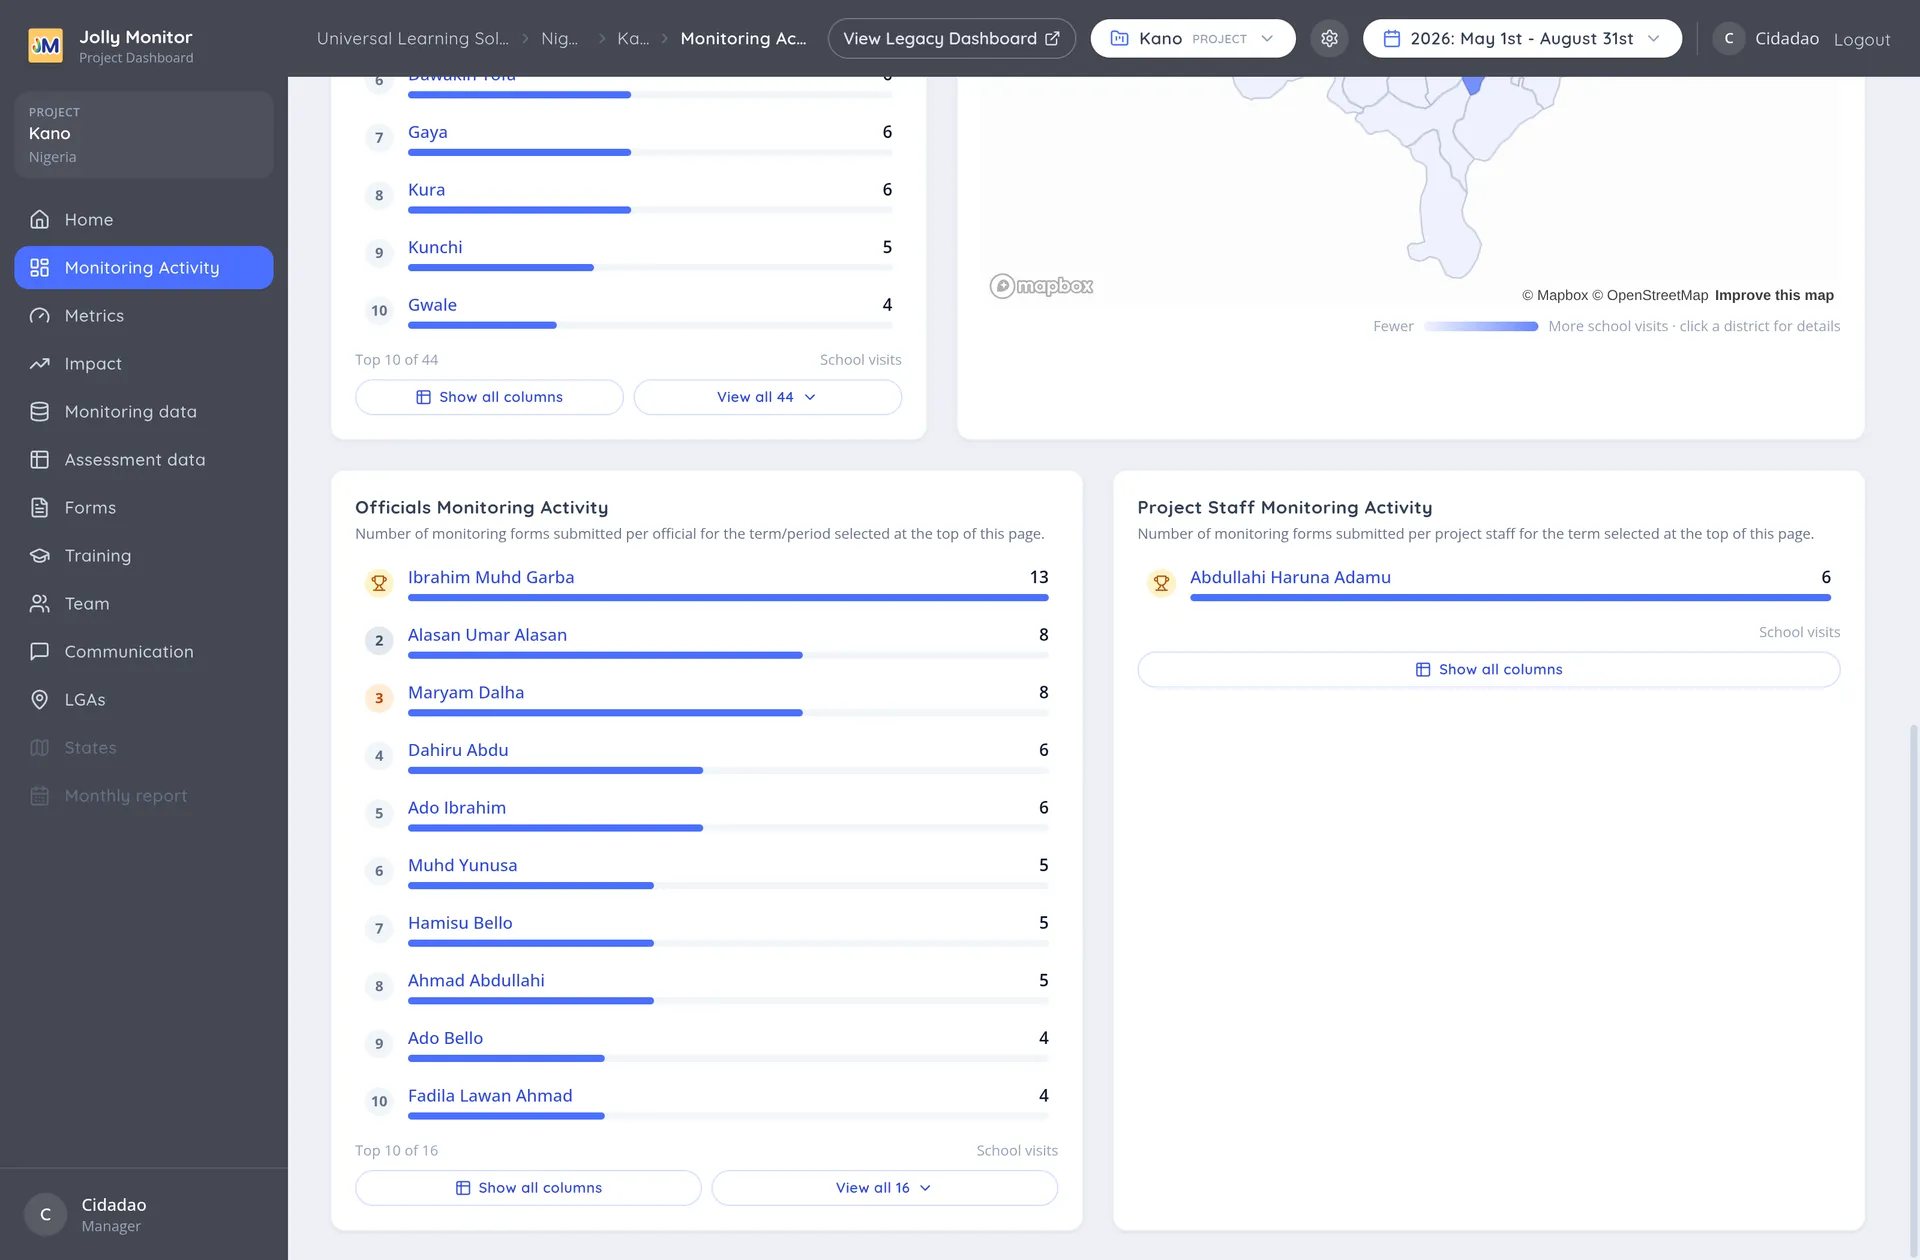
The three leaderboards
Section titled “The three leaderboards”- Districts by activity: which districts have the most monitoring, paired with a map of the region shaded by activity.
- Officials Monitoring Activity: monitoring forms submitted per official.
- Project Staff Monitoring Activity: the same for project staff.
Reading a leaderboard
Section titled “Reading a leaderboard”Each row carries a position, a name and a count. Long tables show the top ten with a footer such as “Top 10 of 16” and a View all link for the rest.
Show all columns reveals the measures that did not fit on screen, so you can rank by teacher visits or pupil assessments rather than school visits.
Names are links: a district opens its page, a person opens their profile with their own visits.
Reading them fairly
Section titled “Reading them fairly”Two things are worth holding in mind before treating a low count as underperformance:
- Districts are not comparable. A monitor covering a compact urban district can make more visits in a day than one crossing a rural district, without working harder. The map beside the district table usually explains the bottom of the ranking.
- Forms submitted is not all the work. Training, mentoring and follow-up do not appear in these counts.
Use a ranking to ask a question, not to answer one. Somebody at zero for a whole term is worth a call; somebody at fourteen instead of twenty rarely is.
The complementary view
Section titled “The complementary view”These tables count activity. For coverage, which is the more useful question when planning, the district’s teacher coverage page lists the teachers who have not been visited in the period. See The district dashboard.
Next: Project Configuration