
Sample groups and assessment data
Assessment data is where pupil scores become evidence about whether the programme is working. The unit of that work is the sample group. Everything here lives in the project’s Assessment data section: pick one or more forms, open or create a report with New report (managers), and the report’s sample groups are where the analysis happens (New sample group, also managers, adds one; everyone else reads them).
What a sample group is
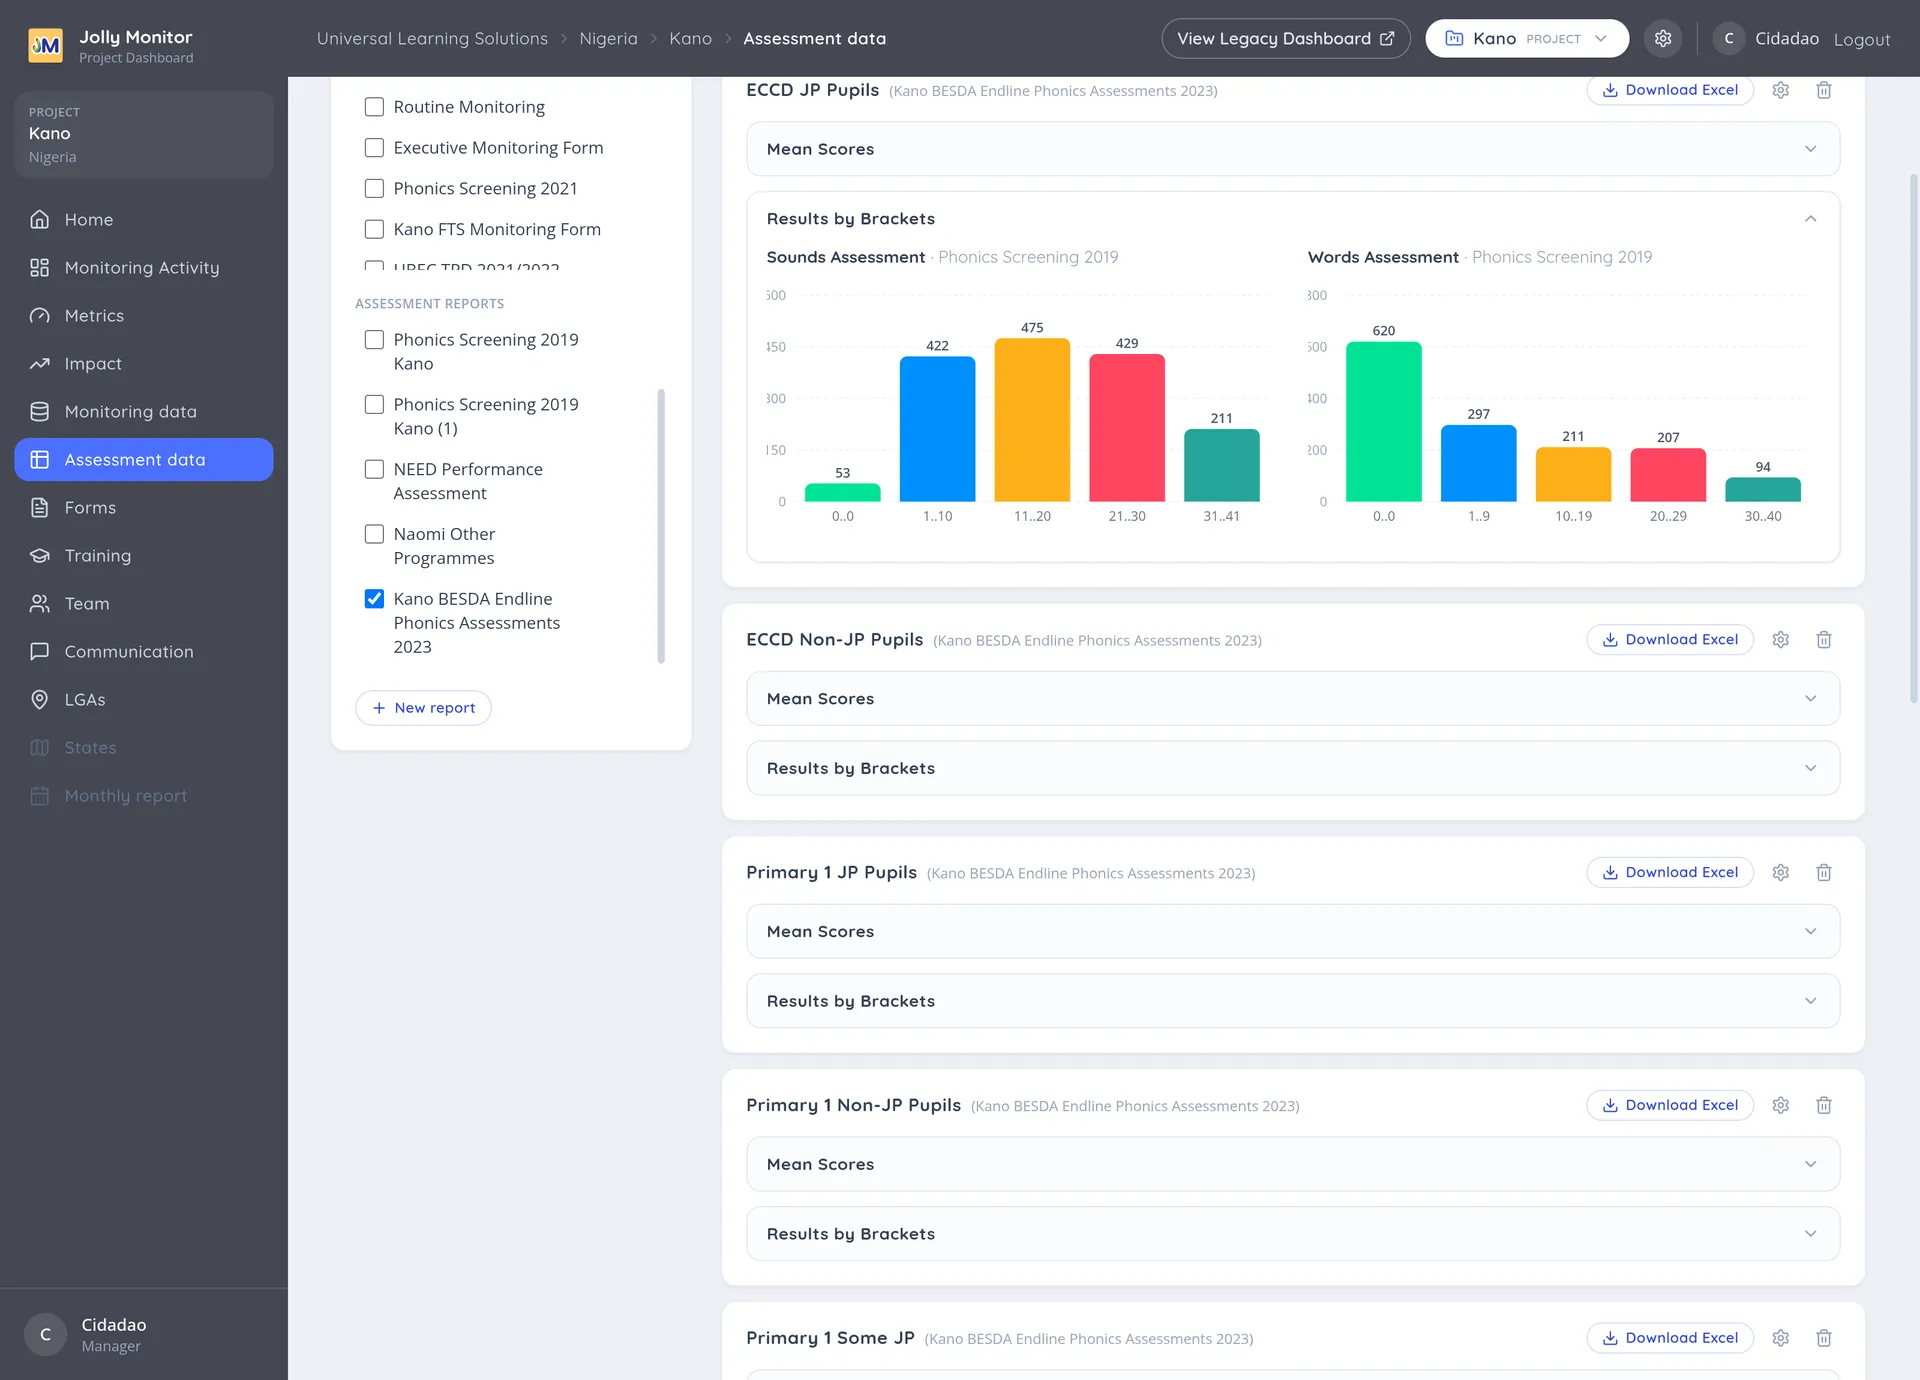
Section titled “What a sample group is”A sample group is a defined set of pupils: from a chosen period, in a chosen place, assessed with a chosen assessment. The dashboard averages their scores and shows how they are distributed across the assessment’s score brackets.
Everything else on this page is built from sample groups, so defining them carefully is most of the work.
Inside a sample group
Section titled “Inside a sample group”A group renders as a card on the Assessment data page itself; expanding it shows its mean scores per assessment section, the results by brackets distribution, and any disaggregations. The individual pupils and their scores are in the group’s spreadsheet download. The sample size is shown throughout, because it is part of the finding rather than a technical footnote.
Building and refining groups
Section titled “Building and refining groups”A group is created under a report with just a name; the report’s form decides which assessment it draws from, and editing the group sets its date range and criteria. Narrowing makes the group more specific and smaller, which is the constant trade-off: a group precise enough to be interesting and large enough to be trusted.
Splits
Section titled “Splits”A disaggregation (the edit dialog’s word for a split) breaks a group down by a characteristic, such as school, district or a question’s answer.
This is where an average that looked fine often falls apart, and it is usually the most valuable thing on the page: a project at 60% made of two districts at 90% and 30% is not a project at 60% in any useful sense.
Comparing groups
Section titled “Comparing groups”A comparison places two or more sample groups side by side. The two common uses are:
- The same year group at two points in time, typically the start and the end of a year, to show progress.
- Programme against non-programme schools over the same period, to show effect.
For a comparison to mean anything the two groups have to differ in one respect only. Comparing this year’s Primary One against last year’s Primary Two mixes a time difference with a year-group difference, and the result cannot be attributed to either.
Exporting
Section titled “Exporting”A sample group downloads as a spreadsheet, and a whole report can be exported with its groups. Both include the pupil-level scores. See Excel exports.
Next: Custom reports